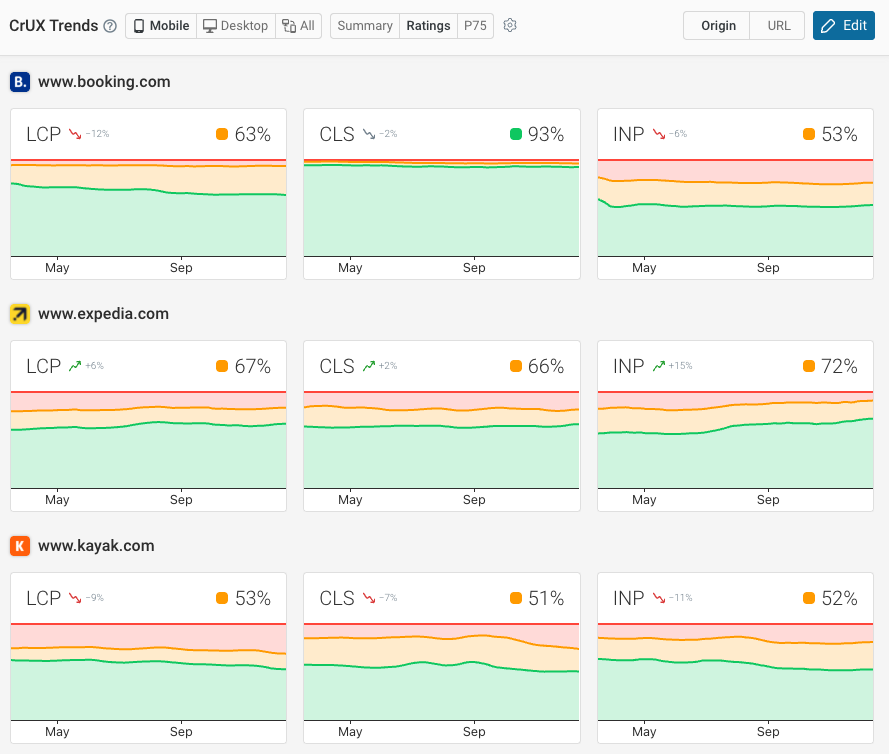
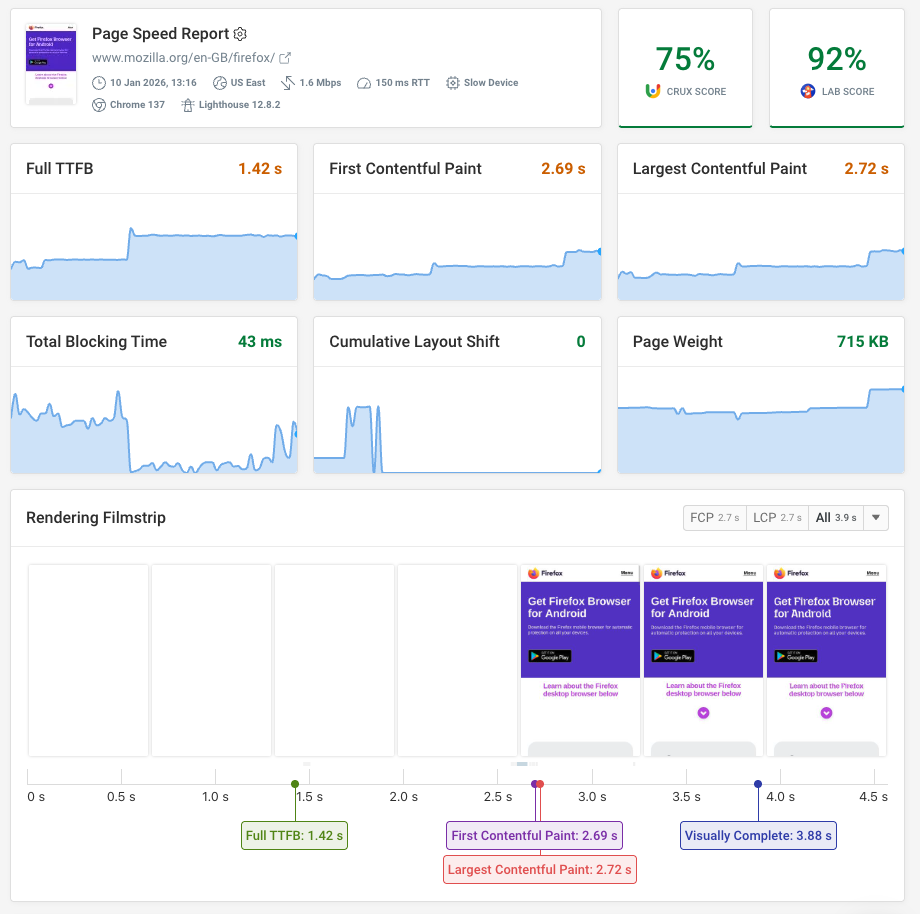
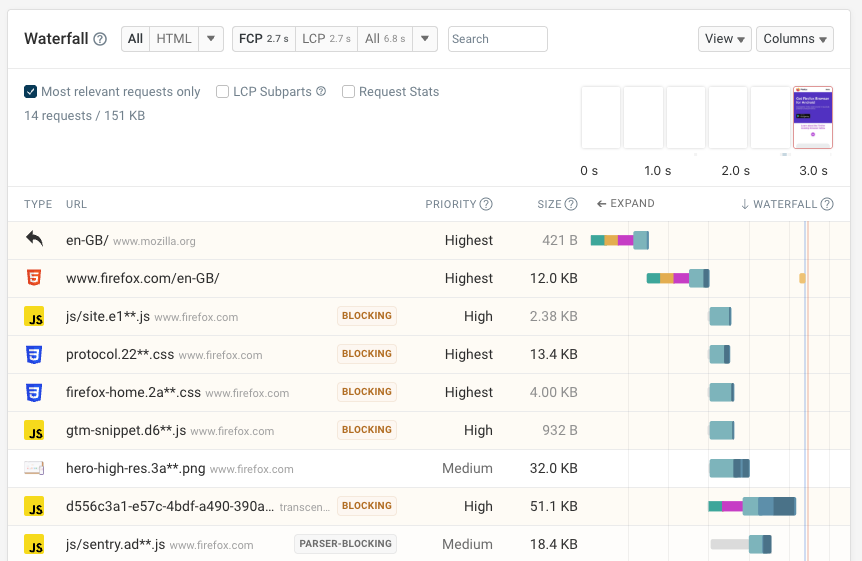
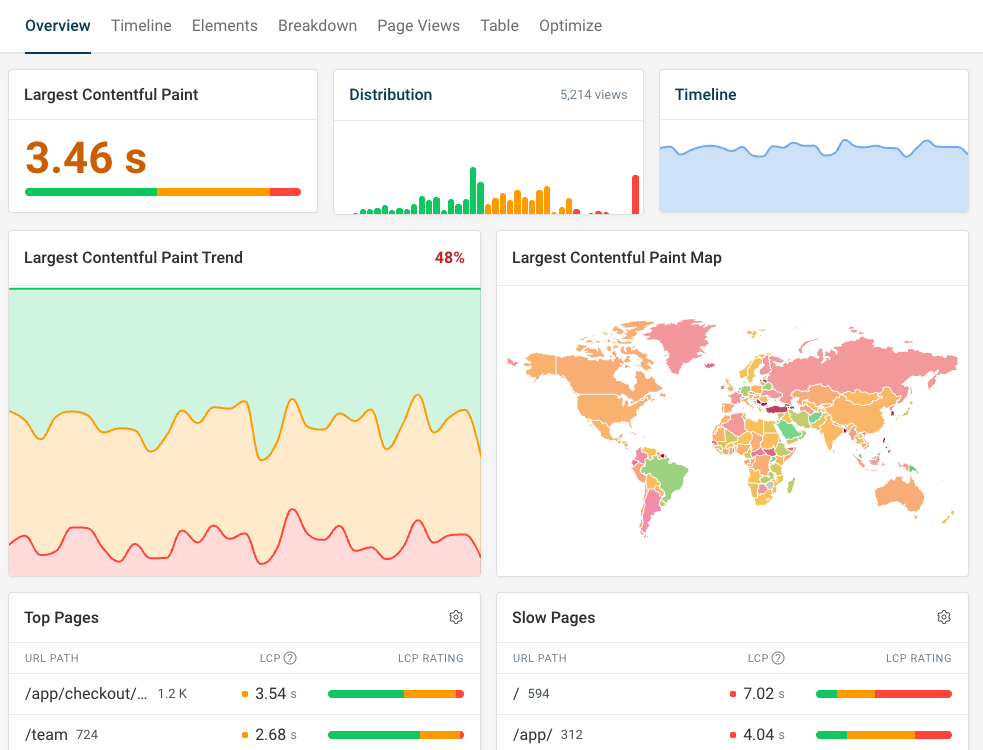
<?xml version="1.0" encoding="utf-8"?>
<feed xmlns="http://www.w3.org/2005/Atom">
    <id>https://www.debugbear.com/software</id>
    <title>DebugBear Blog</title>
    <updated>2026-10-07T00:00:00.000Z</updated>
    <generator>https://github.com/jpmonette/feed</generator>
    <link rel="alternate" href="https://www.debugbear.com/software"/>
    <subtitle>DebugBear Blog</subtitle>
    <icon>https://www.debugbear.com/https://www.debugbear.com/public/favicon-2022-32x32.png</icon>
    <entry>
        <title type="html"><![CDATA[The Best Web Analytics Tools In 2026]]></title>
        <id>https://www.debugbear.com/software/best-web-analytics-tools</id>
        <link href="https://www.debugbear.com/software/best-web-analytics-tools"/>
        <updated>2026-10-07T00:00:00.000Z</updated>
        <summary type="html"><![CDATA[Compare the best web analytics tools to understand where your visitors come from, what they do on your site, and how site experience affects conversions.]]></summary>
        <content type="html"><![CDATA[<p>Web analytics used to mean one thing: Google Analytics. Today the market has split into three groups. Google Analytics remains the free default with deep ad integrations, lightweight privacy-first tools like Plausible and Fathom offer simple dashboards without cookie banners, and product analytics platforms like PostHog and Mixpanel track individual user journeys in detail.</p>
<p>Website monitoring tools like DebugBear add a fourth angle, combining visitor data with page speed metrics to show how site experience affects conversions.</p>
<p>This article takes a look at eight tools you can use to measure website visits and what their respective strengths are.</p>
<h2 class="anchor anchorWithStickyNavbar_FNw8" id="what-is-web-analytics">What is web analytics?<a href="https://www.debugbear.com/software/best-web-analytics-tools#what-is-web-analytics" class="hash-link" aria-label="Direct link to What is web analytics?" title="Direct link to What is web analytics?">​</a></h2>
<p>Web analytics tools can tell you a range of information about what's happening on your website. For example, for each page view you get some basic information.</p>
<ul>
<li>How many page views do different pages get?</li>
<li>Are they direct visits, or referrals from Google, Facebook, and other sources?</li>
<li>Where are people visiting your website from?</li>
</ul>
<p>Beyond the basic data, web analytics services can also provide additional insight:</p>
<ul>
<li>Conversion tracking: did visitors start a trial or make a purchase?</li>
<li>Session tracking: how did visitors navigate through your website?</li>
<li>Web performance: did users have a fast experience and did you pass Google's <a href="https://www.debugbear.com/docs/metrics/core-web-vitals">Core Web Vitals</a>?</li>
</ul>
<h2 class="anchor anchorWithStickyNavbar_FNw8" id="1-debugbear">1. DebugBear<a href="https://www.debugbear.com/software/best-web-analytics-tools#1-debugbear" class="hash-link" aria-label="Direct link to 1. DebugBear" title="Direct link to 1. DebugBear">​</a></h2>
<p>DebugBear is a website monitoring platform that includes <a href="https://www.debugbear.com/real-user-monitoring">real user monitoring</a> for website analytics and performance.</p>
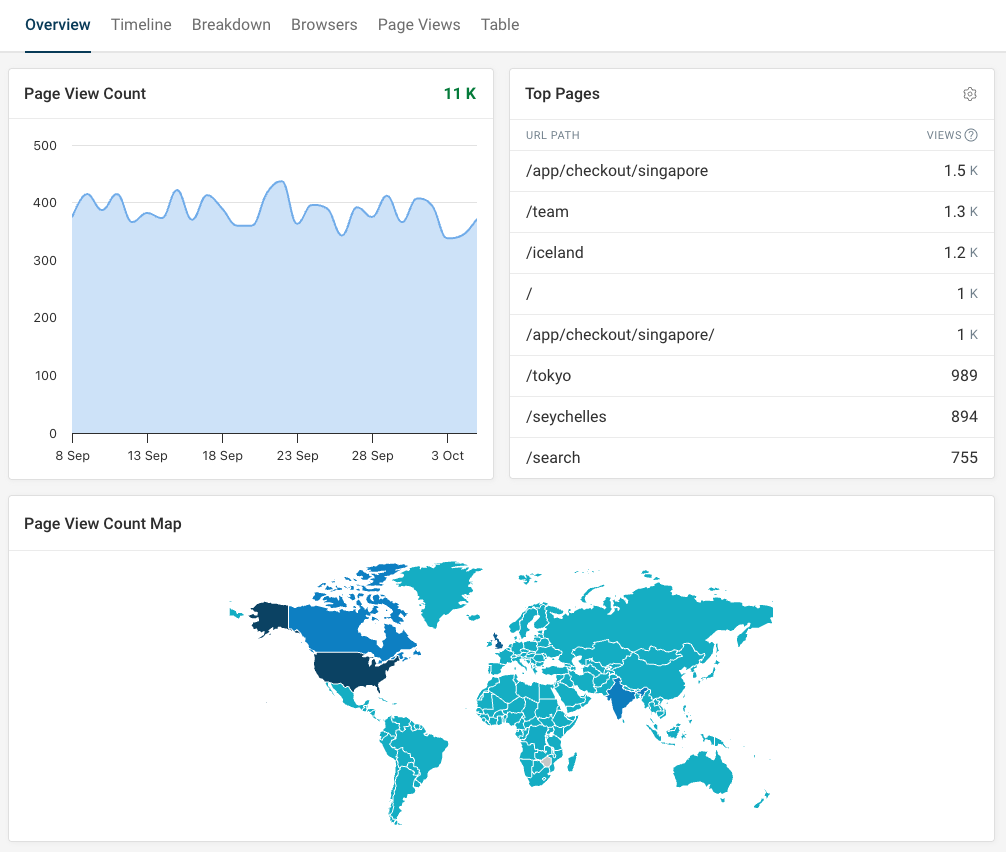
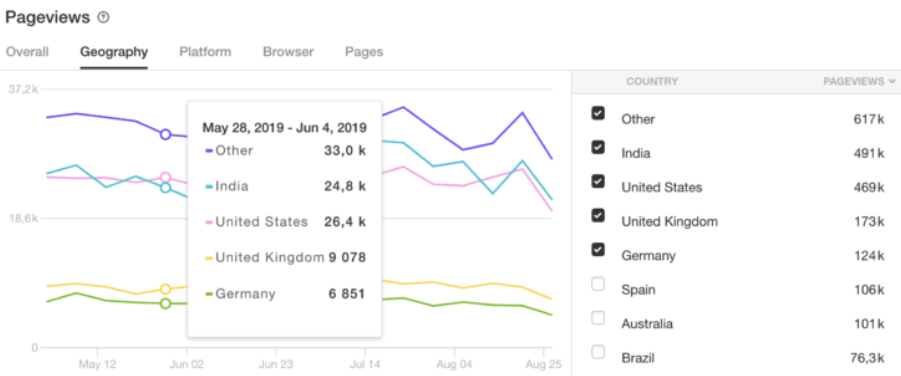
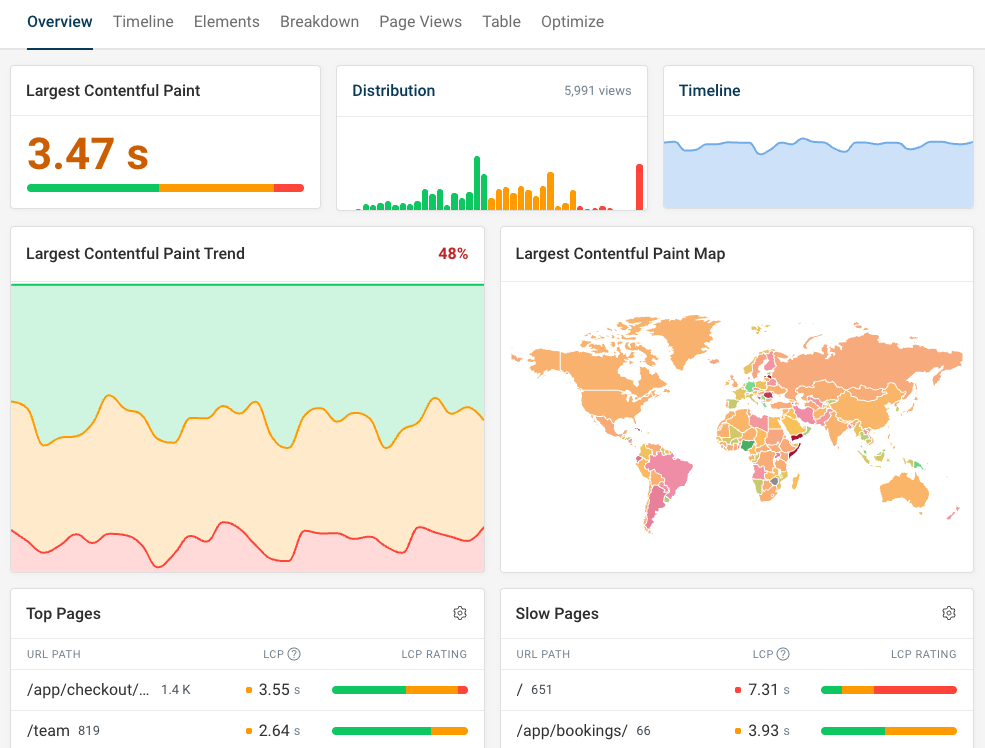
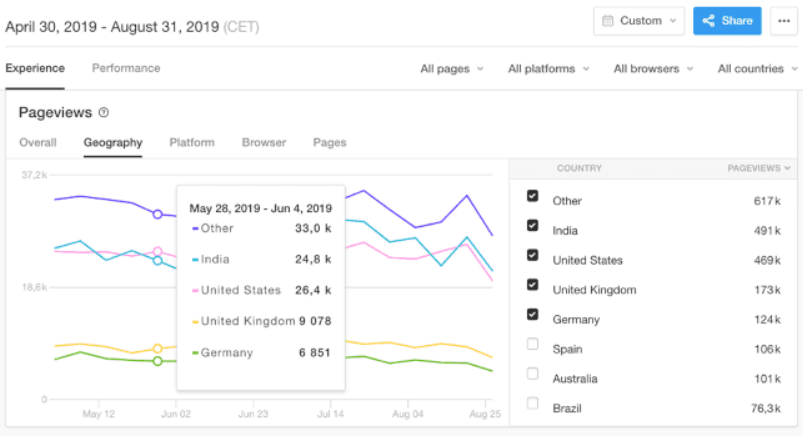
<p>The <a href="https://www.debugbear.com/docs/rum/real-user-monitoring#view-count">View Count tab</a> focuses on basic web analytics like page views, traffic sources, and visitor countries.</p>
<p><img loading="lazy" src="https://www.debugbear.com/dimg/2e372fb2ff9ce80941043fa1ef83d2a1.png" alt="DebugBear View Count tab showing page views over time, top pages, and a visitor map" style="border-radius:4px" data-abc="true" class="img_CujE"></p>
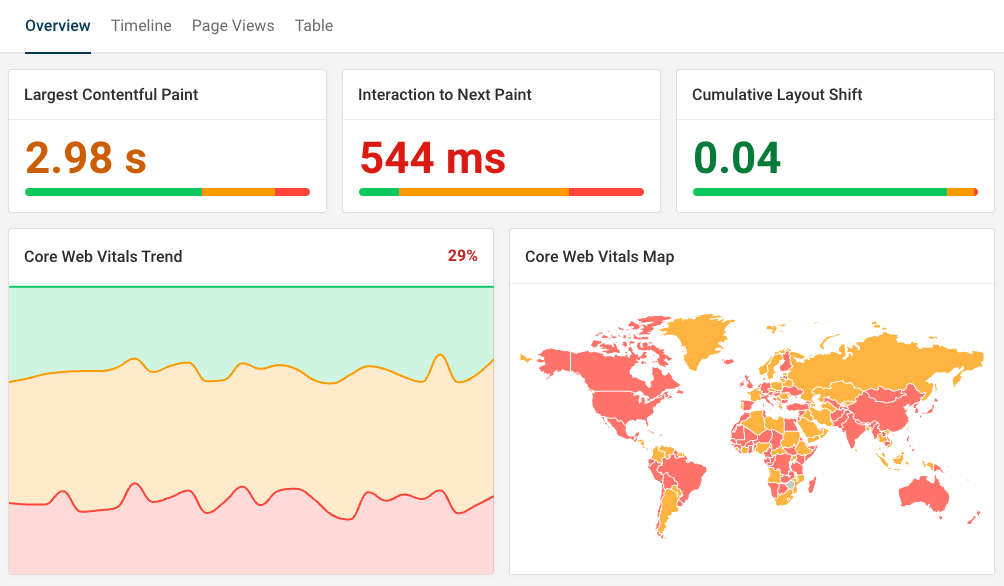
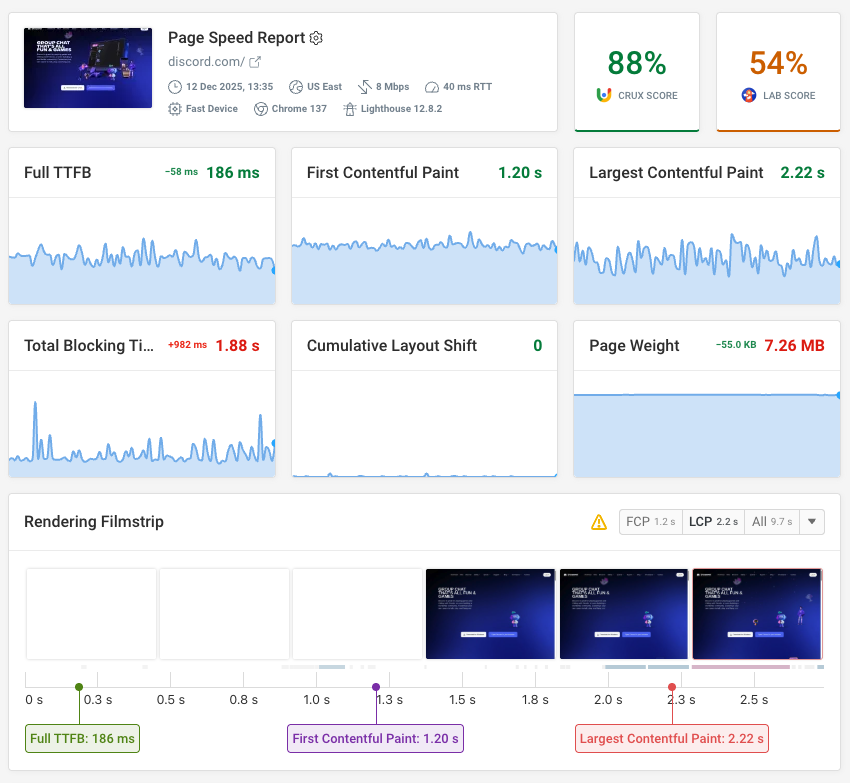
<p>The special focus of the tool is website performance and Core Web Vitals monitoring. You can get in-depth data on how fast your website is and what's slowing it down.</p>
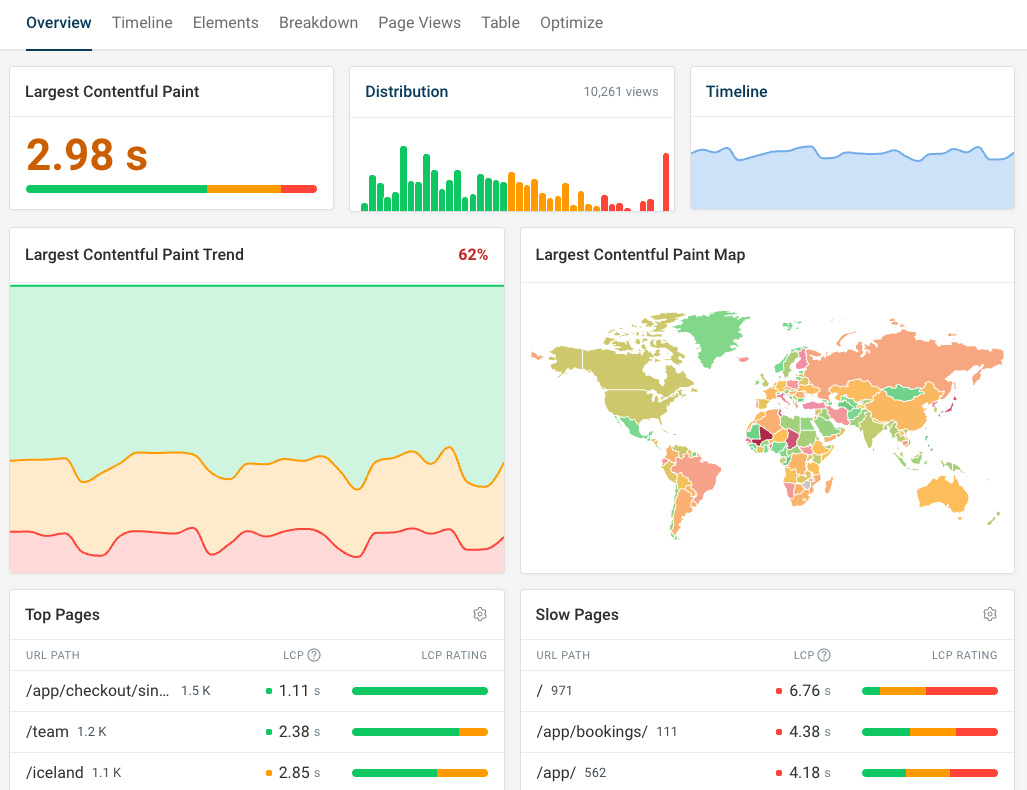
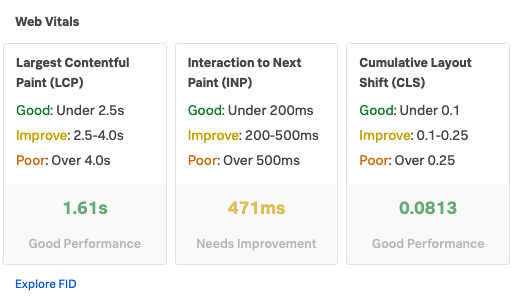
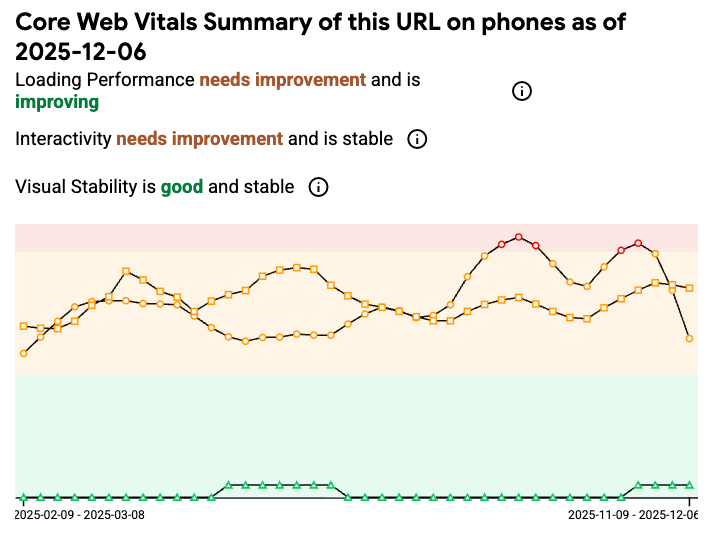
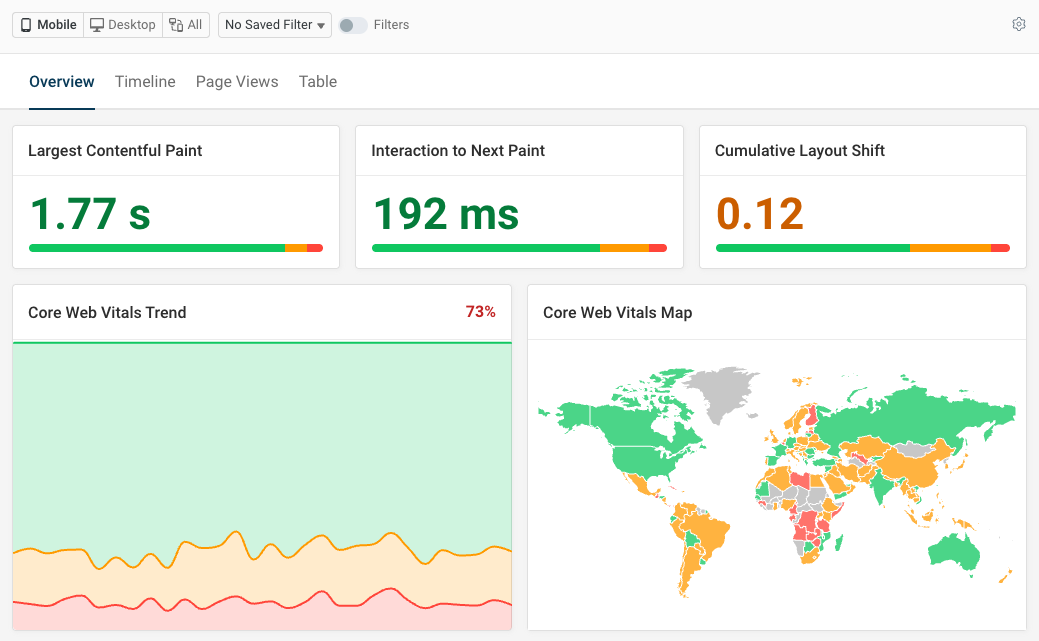
<p>This dashboard shows Google's <a href="https://www.debugbear.com/docs/core-web-vitals-ranking-factor">three key performance metrics that impact rankings</a>: Largest Contentful Paint, Interaction to Next Paint, and Cumulative Layout Shift.</p>
<p><img loading="lazy" src="https://www.debugbear.com/dimg/e9324af4daf9ce3c4701aa288bcad4f9.png" alt="Core Web Vitals dashboard" style="border-radius:4px" data-abc="true" class="img_CujE"></p>
<p>DebugBear doesn't track visitors or collect personal data by default. If you want to correlate page speed with business outcomes, you can optionally enable <a href="https://www.debugbear.com/docs/rum/conversion-tracking">session and conversion tracking</a>.</p>
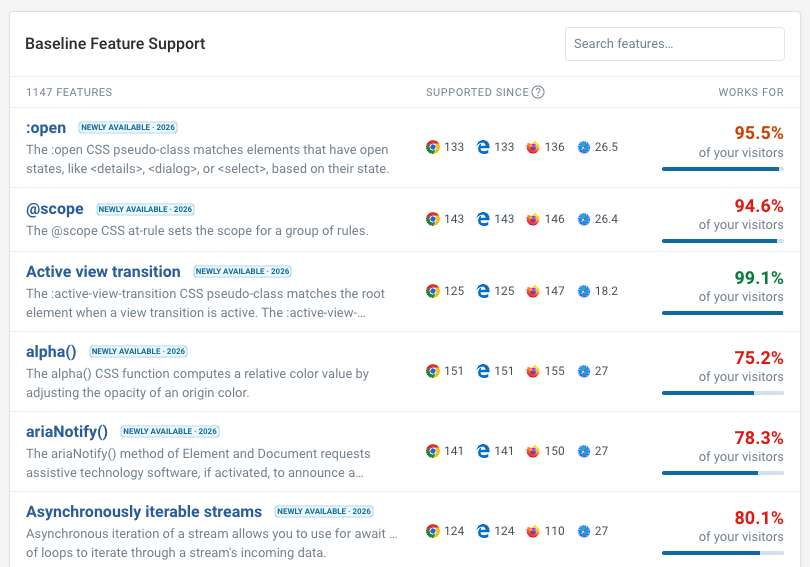
<p>Technical data like visitor network speeds or <a href="https://www.debugbear.com/docs/rum/browser-support">browser versions</a> is available as well. Based on browser data, DebugBear can tell you what web platform features are safe to use on your website.</p>
<p><img loading="lazy" src="https://www.debugbear.com/dimg/66d164e692a4b9369e44e92f04d974d6.png" alt="DebugBear browser version feature support analysis" style="aspect-ratio:1.429;width:100%;max-width:810px;border-radius:4px" data-abc="true" class="img_CujE"></p>
<p>The real user monitoring feature provides in-depth analytics for your website and helps you optimize performance. In addition to measuring real user experience, DebugBear provides scheduled <a href="https://www.debugbear.com/docs/synthetic-website-monitoring">synthetic tests</a> and <a href="https://www.debugbear.com/docs/uptime-monitoring">uptime monitoring</a>.</p>
<h2 class="anchor anchorWithStickyNavbar_FNw8" id="2-google-analytics-4">2. Google Analytics 4<a href="https://www.debugbear.com/software/best-web-analytics-tools#2-google-analytics-4" class="hash-link" aria-label="Direct link to 2. Google Analytics 4" title="Direct link to 2. Google Analytics 4">​</a></h2>
<p>Google's Analytics service provides a lot of analysis options and tightly integrates with other Google services like their ad platform.</p>
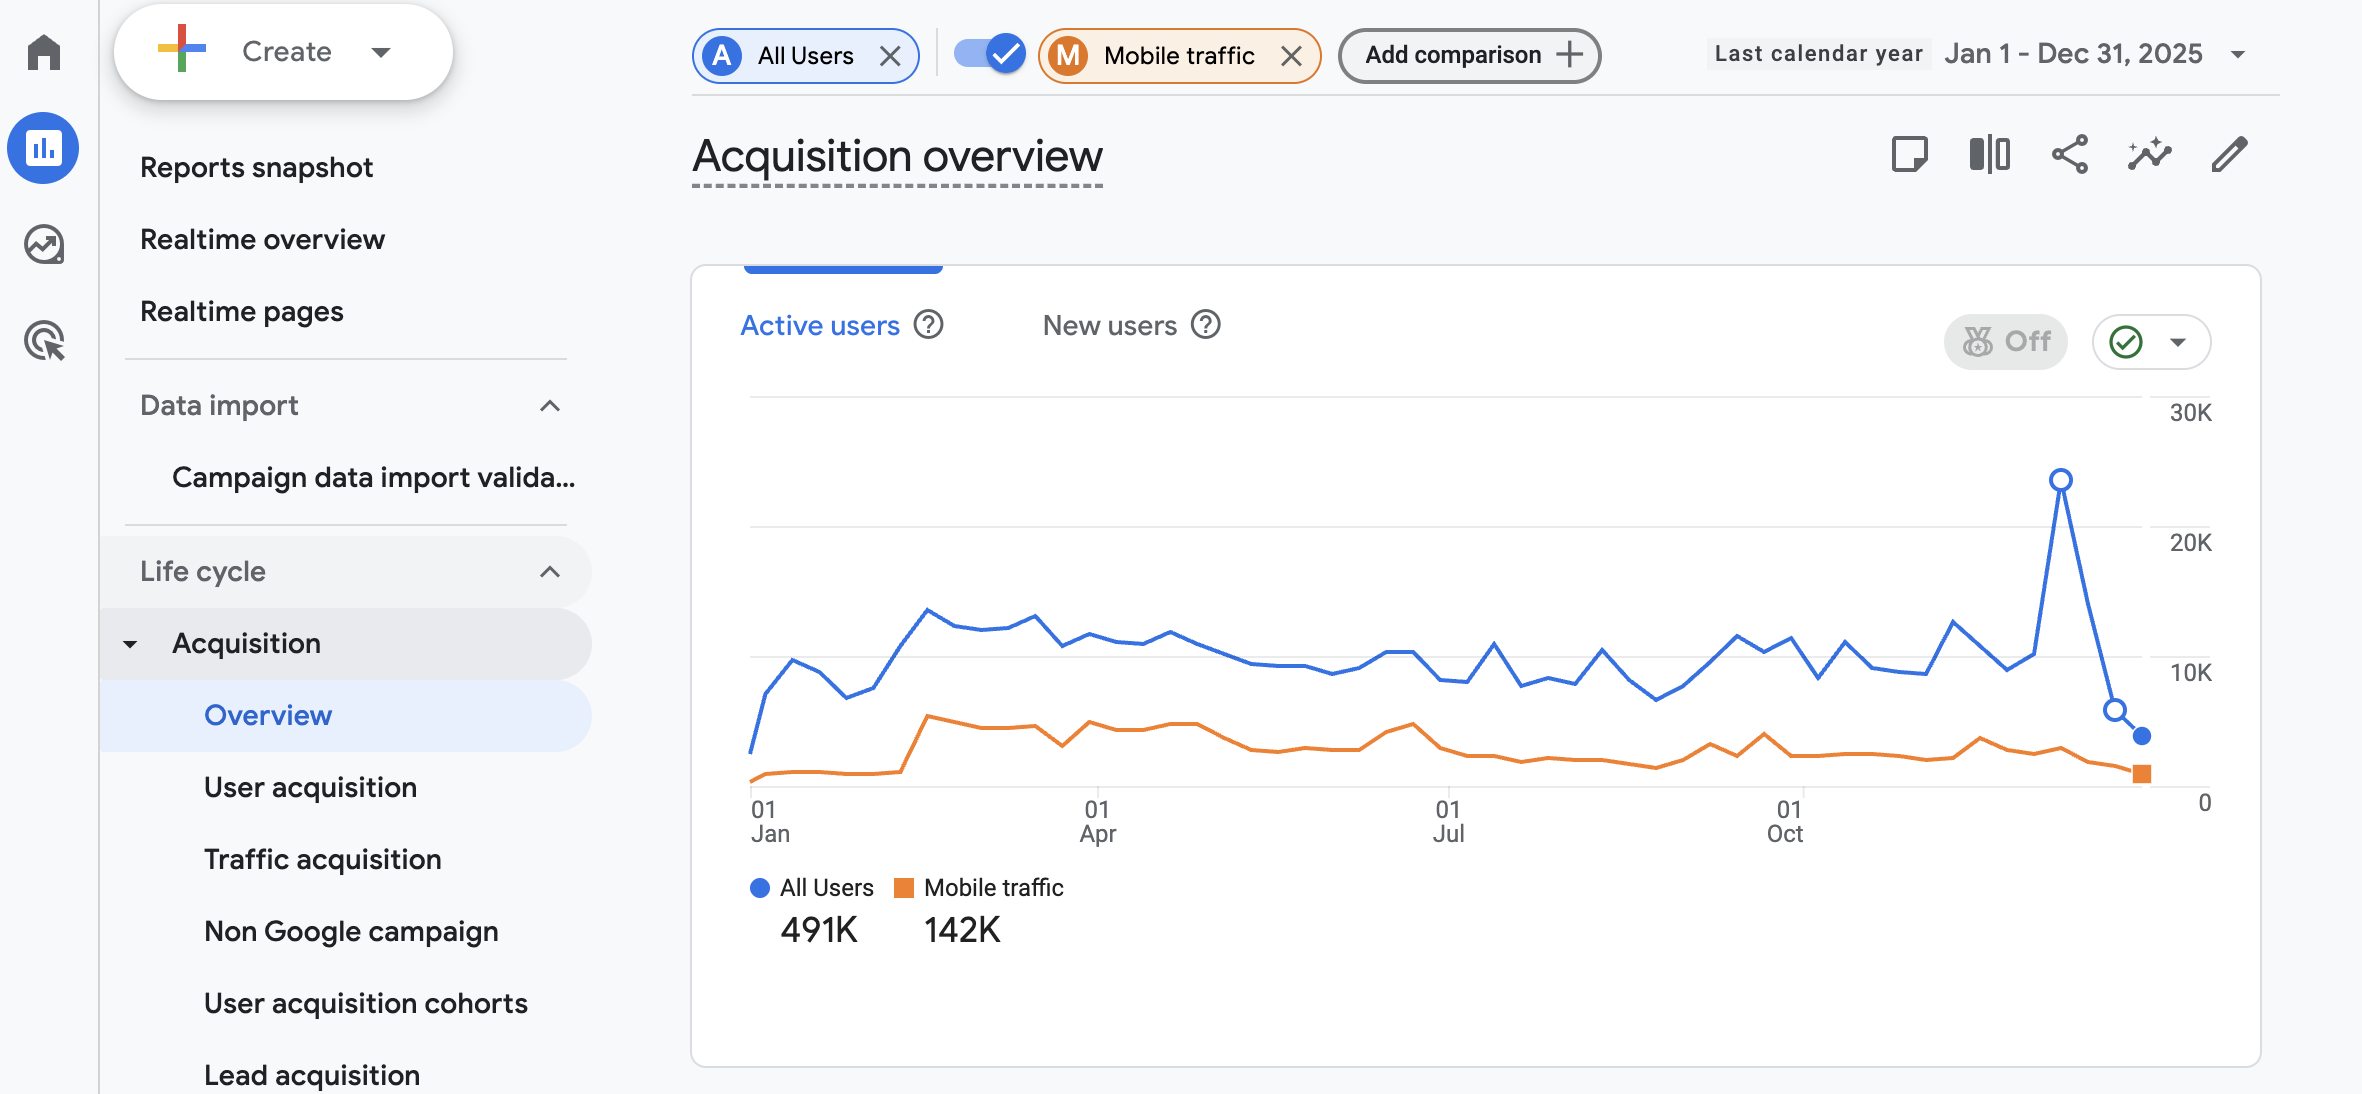
<p>It's free and lets you configure detailed attribution models and conversion funnels. However, it can come with a steep learning curve.</p>
<p><img loading="lazy" src="https://www.debugbear.com/dimg/455984a5c1871c8d2e4779adbd5922c5.png" alt="Google Analytics 4 acquisition overview comparing all users to mobile traffic" style="border-radius:4px" data-abc="true" class="img_CujE"></p>
<p>You can see how visitors arrived on your website and then filter and segment your data based on technical and demographic values Google collects automatically and any custom events you report.</p>
<p>The Google Analytics monetization section lets you deep dive into user journeys and purchases.</p>
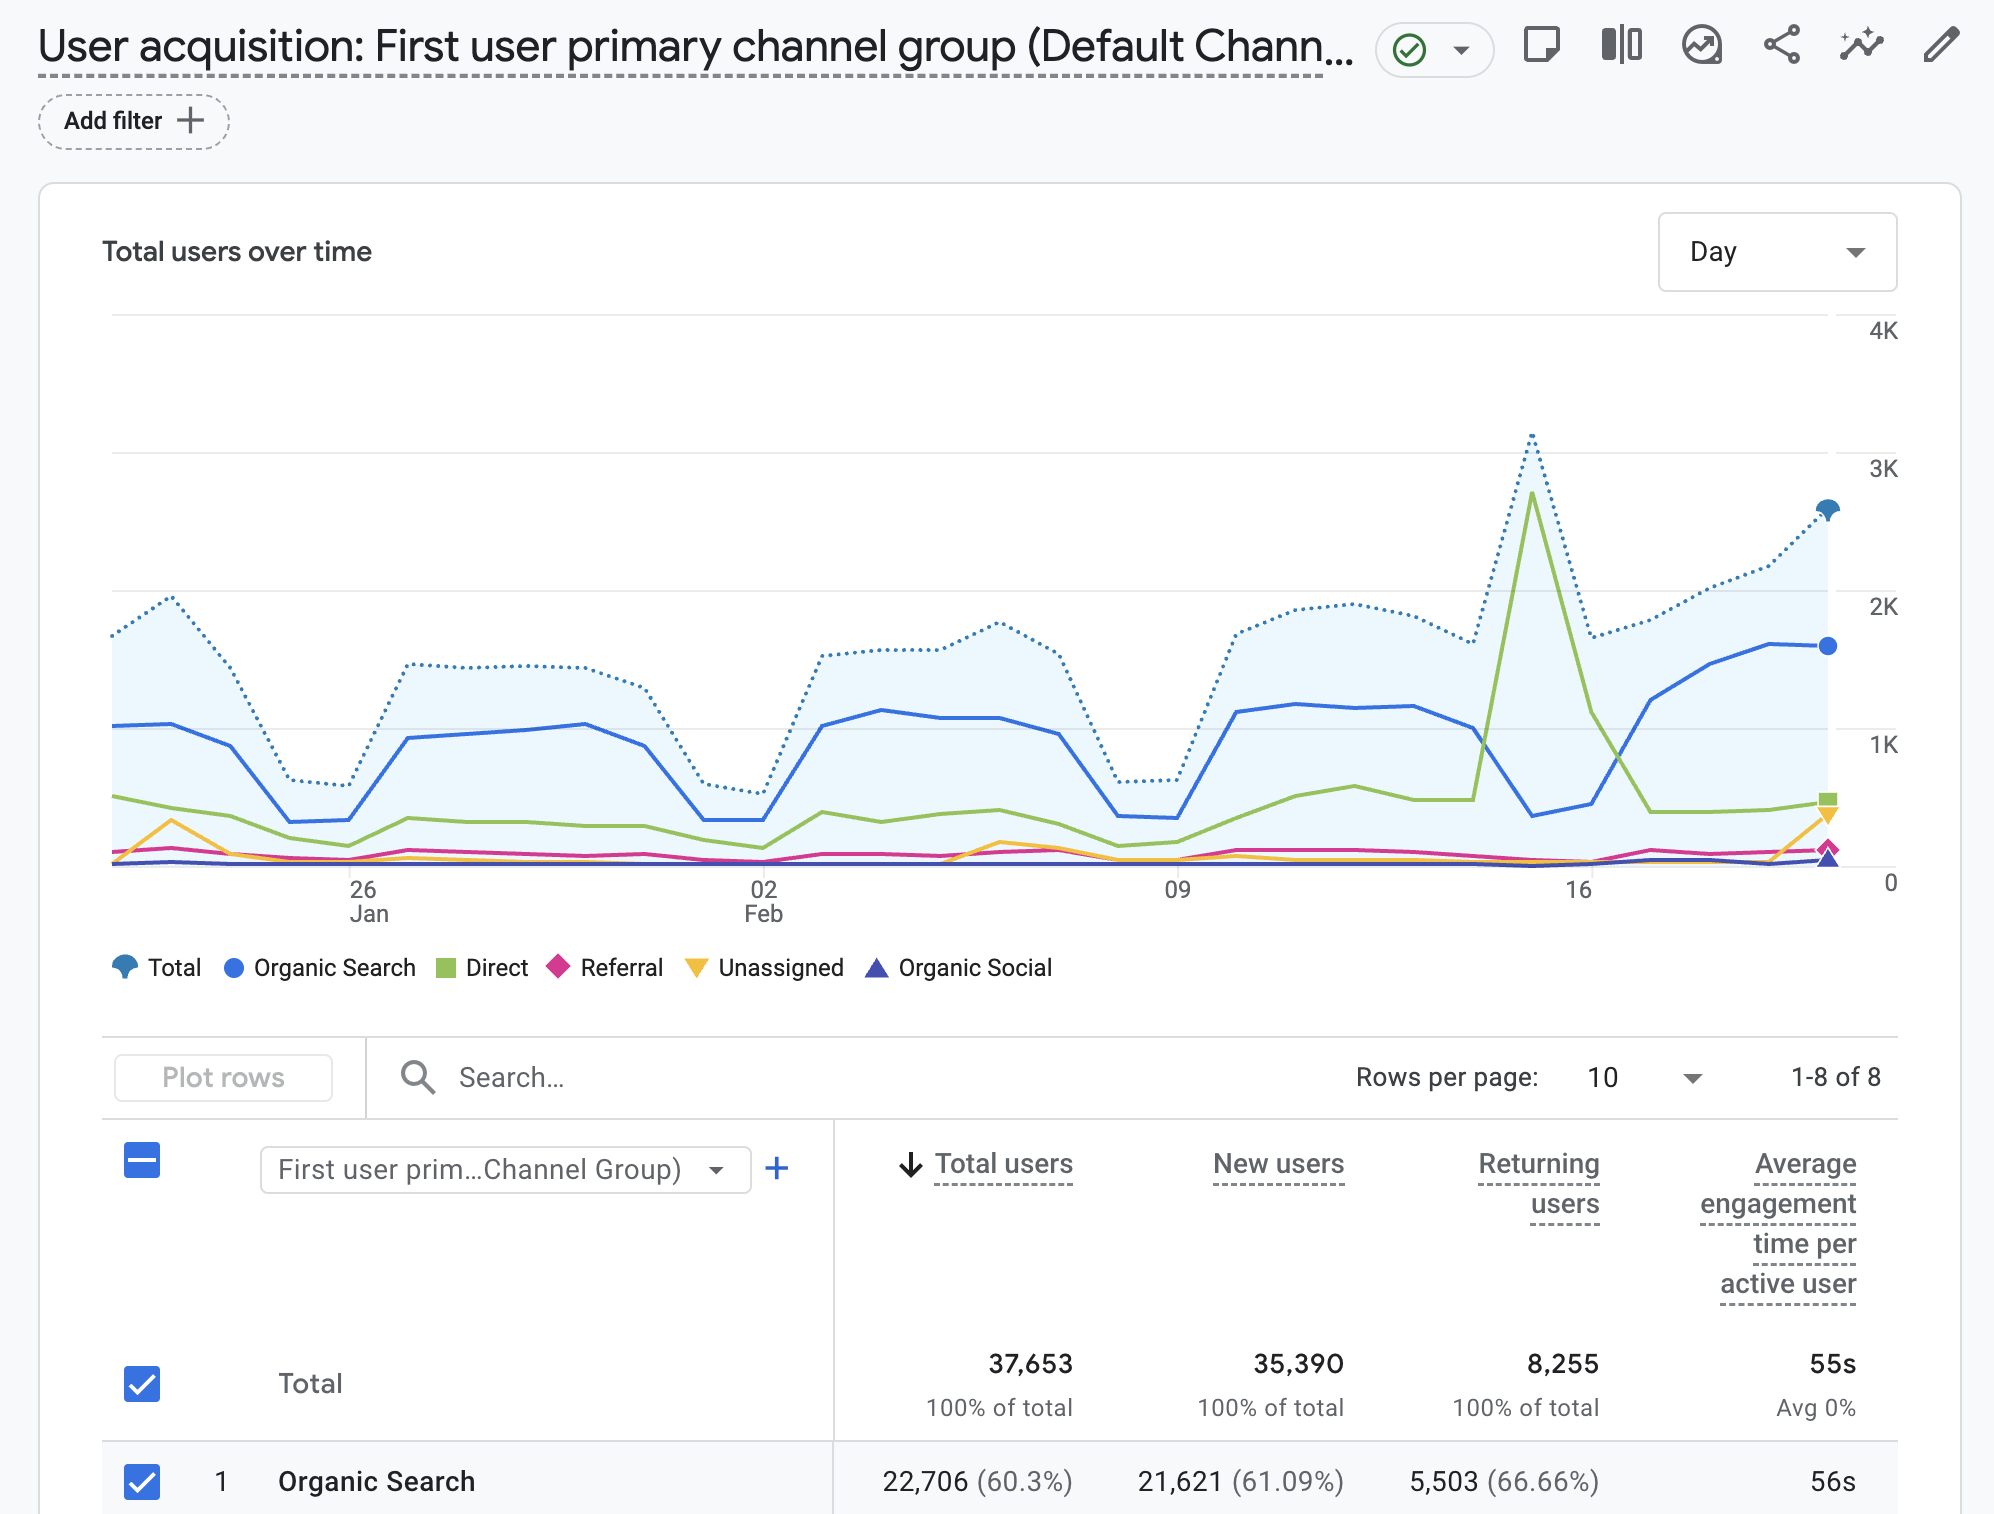
<p><img loading="lazy" src="https://www.debugbear.com/dimg/a154bfe7a83259166b60e6b225d3cdf0.png" alt="Google Analytics user acquisition report broken down by channel group" style="border-radius:4px" data-abc="true" class="img_CujE"></p>
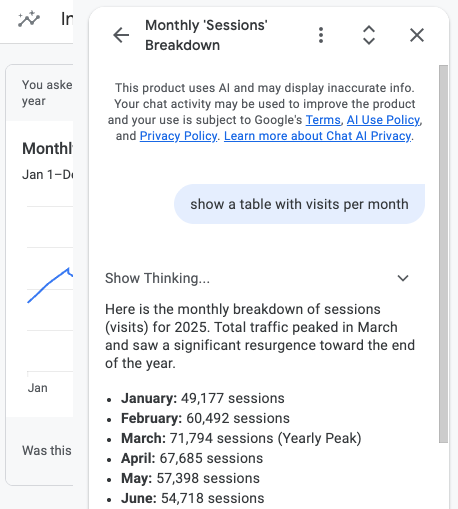
<p>Google also provides an Ask Advisor AI feature that lets you get insights inside the app without having to manually configure each report.</p>
<p><img loading="lazy" src="https://www.debugbear.com/dimg/f26017011936d96c3ea0ee4958559c9e.png" alt="Google Analytics AI chat showing a monthly sessions breakdown" style="border-radius:4px" data-abc="true" class="img_CujE"></p>
<h2 class="anchor anchorWithStickyNavbar_FNw8" id="3-plausible">3. Plausible<a href="https://www.debugbear.com/software/best-web-analytics-tools#3-plausible" class="hash-link" aria-label="Direct link to 3. Plausible" title="Direct link to 3. Plausible">​</a></h2>
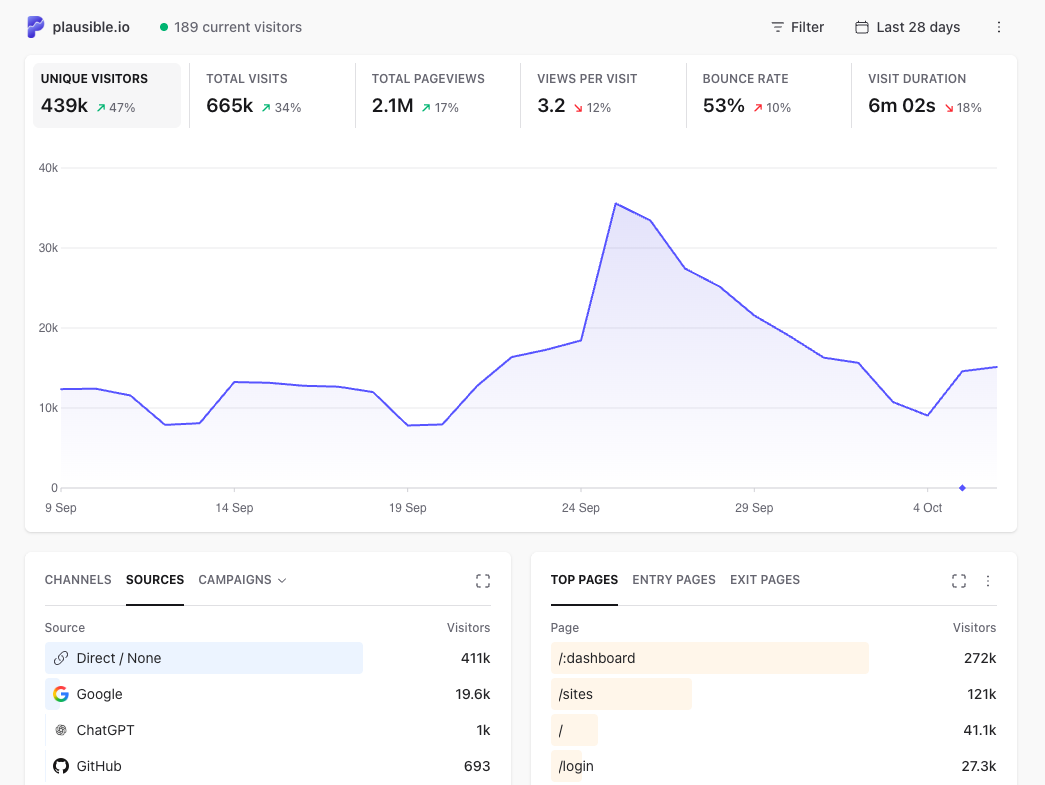
<p>Plausible is a lightweight web analytics tool that's a simpler privacy-focused alternative to Google Analytics. It's easy to use and lets you identify traffic trends and what pages are converting.</p>
<p>The tracking script is under 1 KB and doesn't use cookies, so you don't need a consent banner to comply with GDPR. The product is open source and the hosted version stores all data in the EU. Pricing is based on monthly page views.</p>
<p><img loading="lazy" src="https://www.debugbear.com/dimg/9da26fa9864902ae7d590fa2a5e07a60.png" alt="Plausible dashboard with visitor trends, traffic sources, and top pages" style="border-radius:4px" data-abc="true" class="img_CujE"></p>
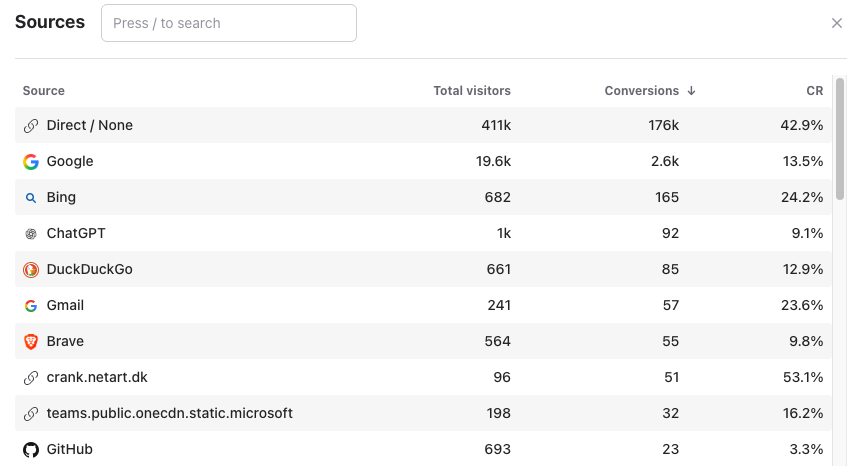
<p>Traffic sources break down by high-level channel, specific source, or UTM campaign parameter (the <code>utm_source</code>, <code>utm_medium</code>, and <code>utm_campaign</code> values in a URL). Plausible then lets you filter data by visitor location, browser, operating system, or screen size.</p>
<p><img loading="lazy" src="https://www.debugbear.com/dimg/7ae5905cc5f8af65fbfb12accd923c68.png" alt="Plausible traffic sources table with conversion rates per source" style="border-radius:4px" data-abc="true" class="img_CujE"></p>
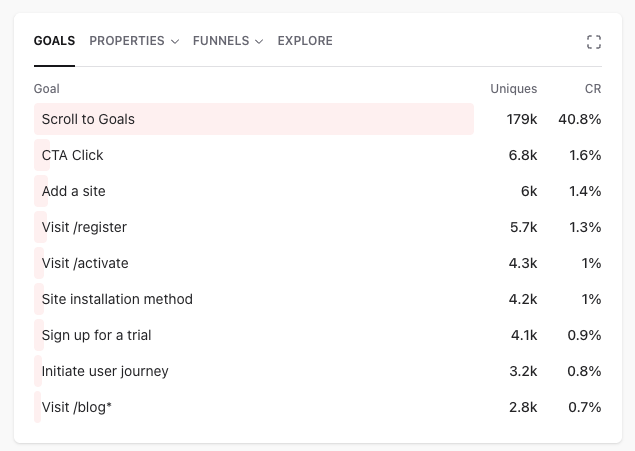
<p>Goals and conversion funnels are also supported. Each goal shows how many unique visitors completed it and the resulting conversion rate, so you can see which marketing channels bring in visitors who actually sign up.</p>
<p><img loading="lazy" src="https://www.debugbear.com/dimg/3e84f3b7217fcbf40c73794be30cefef.png" alt="Plausible goals report showing conversion rates for each goal" style="border-radius:4px" data-abc="true" class="img_CujE"></p>
<h2 class="anchor anchorWithStickyNavbar_FNw8" id="4-fathom-analytics">4. Fathom Analytics<a href="https://www.debugbear.com/software/best-web-analytics-tools#4-fathom-analytics" class="hash-link" aria-label="Direct link to 4. Fathom Analytics" title="Direct link to 4. Fathom Analytics">​</a></h2>
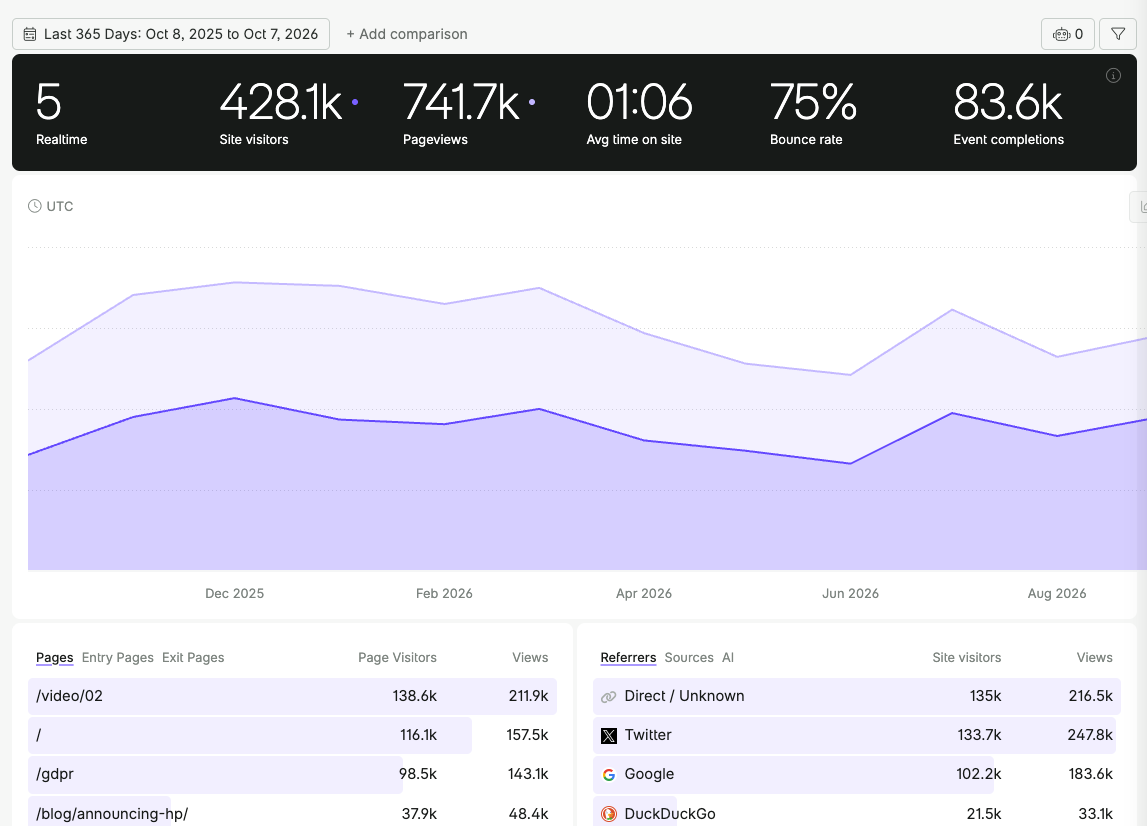
<p>Fathom is similar to Plausible in many ways: it's a simple alternative to Google Analytics. Neither Plausible nor Fathom uses cookies for tracking, so neither requires a cookie consent banner.</p>
<p>Unlike Plausible, Fathom is not open source. It includes unlimited websites on every plan and bundles basic uptime monitoring with the analytics product.</p>
<p><img loading="lazy" src="https://www.debugbear.com/dimg/806d1da51d2e7367fa68275c2c7ad78b.png" alt="Fathom Analytics dashboard with site visitors, pageviews, bounce rate, and referrers" style="border-radius:4px" data-abc="true" class="img_CujE"></p>
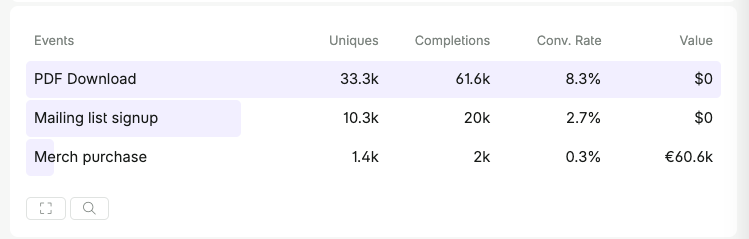
<p>Fathom supports custom events and lets you record how much each transaction is worth to you. That way you can see not just how many conversions a page generates but what revenue it brings in.</p>
<p><img loading="lazy" src="https://www.debugbear.com/dimg/5574922a97b4dd086e8c2343e6da20f7.png" alt="Fathom events table with completions, conversion rate, and value" style="border-radius:4px" data-abc="true" class="img_CujE"></p>
<h2 class="anchor anchorWithStickyNavbar_FNw8" id="5-matomo">5. Matomo<a href="https://www.debugbear.com/software/best-web-analytics-tools#5-matomo" class="hash-link" aria-label="Direct link to 5. Matomo" title="Direct link to 5. Matomo">​</a></h2>
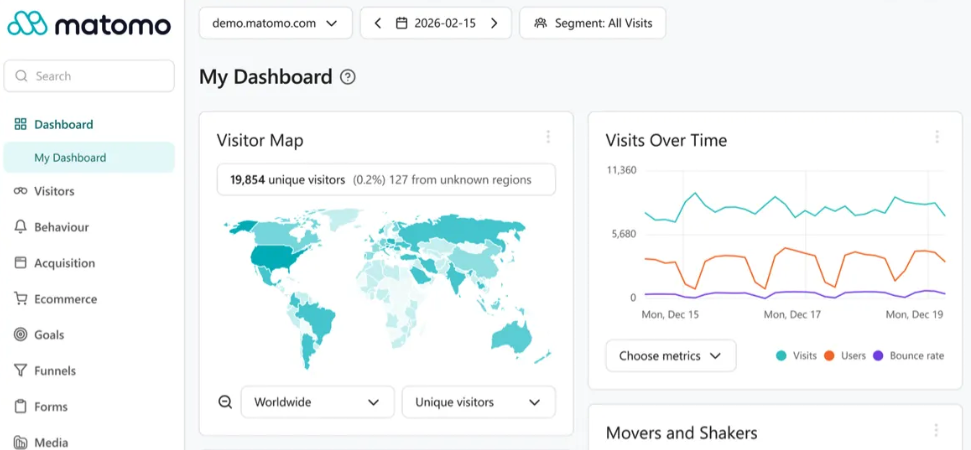
<p>Matomo (formerly Piwik) is another tool that provides visitor analytics and marketing attribution data. The core product is open source, with paid addons and a hosted cloud version available.</p>
<p>It's more complex and full-featured compared to Plausible or Fathom. For example, you can select one of several attribution models like Last Non-Direct Channel or First Interaction.</p>
<p><img loading="lazy" src="https://www.debugbear.com/dimg/812af4bec572327201d0df9d53d8db7d.png" alt="Matomo dashboard with visitor map and visits over time" style="border-radius:4px" data-abc="true" class="img_CujE"></p>
<p>In addition to basic traffic reporting, Matomo provides session recordings, heatmaps, detailed funnel analysis, A/B testing insights, and more.</p>
<h2 class="anchor anchorWithStickyNavbar_FNw8" id="6-umami">6. Umami<a href="https://www.debugbear.com/software/best-web-analytics-tools#6-umami" class="hash-link" aria-label="Direct link to 6. Umami" title="Direct link to 6. Umami">​</a></h2>
<p>Umami analytics helps you measure your website traffic and analyze behavior, conversions, and visitor retention. It's open source under the MIT licence, so you can self-host it for free, or use the hosted Umami Cloud version.</p>
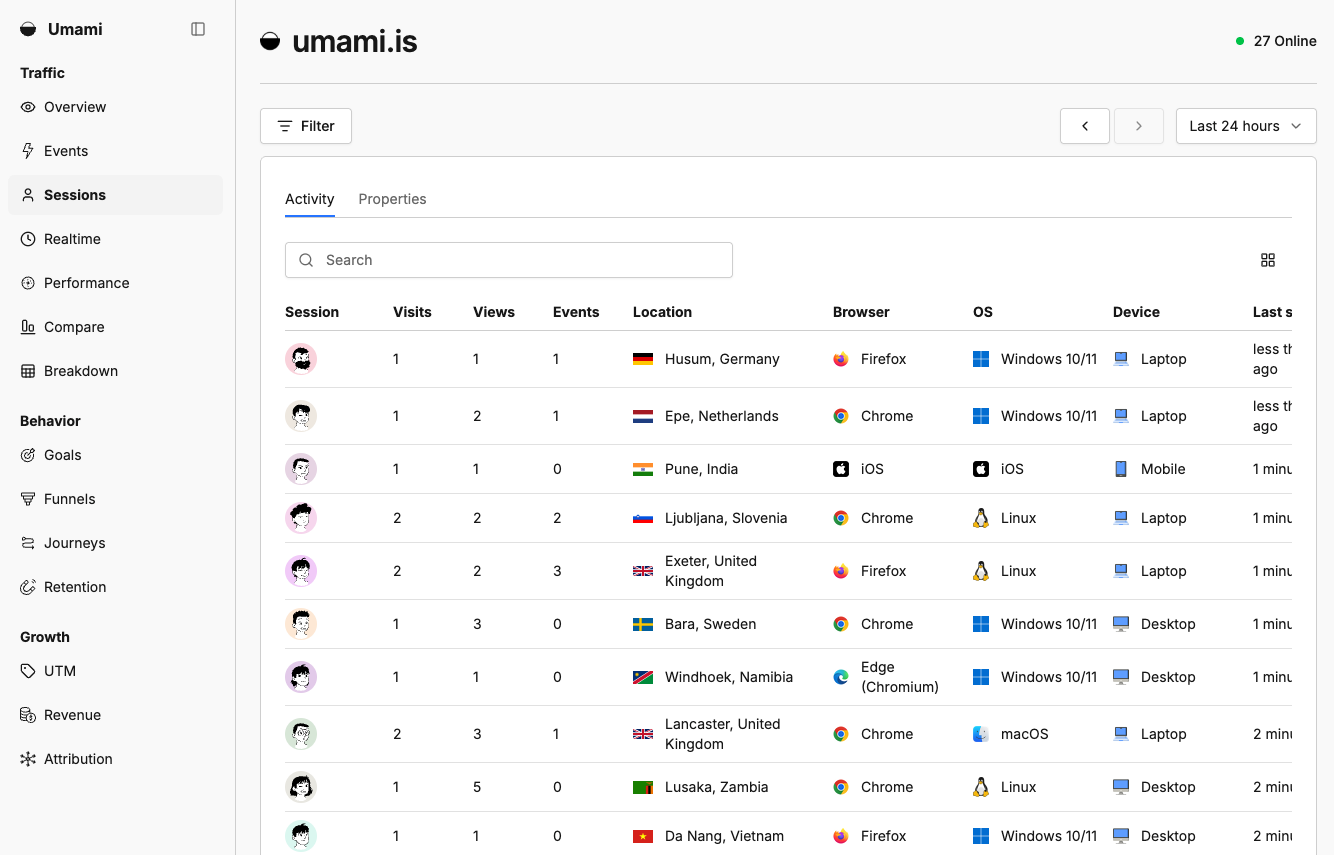
<p>Unlike Plausible or Fathom, Umami lets you view individual page views and user sessions in addition to the high-level analytics.</p>
<p><img loading="lazy" src="https://www.debugbear.com/dimg/72fd0b05fcc480c0474de85f890066f3.png" alt="Umami sessions view listing individual visitors with location, browser, and device" style="border-radius:4px" data-abc="true" class="img_CujE"></p>
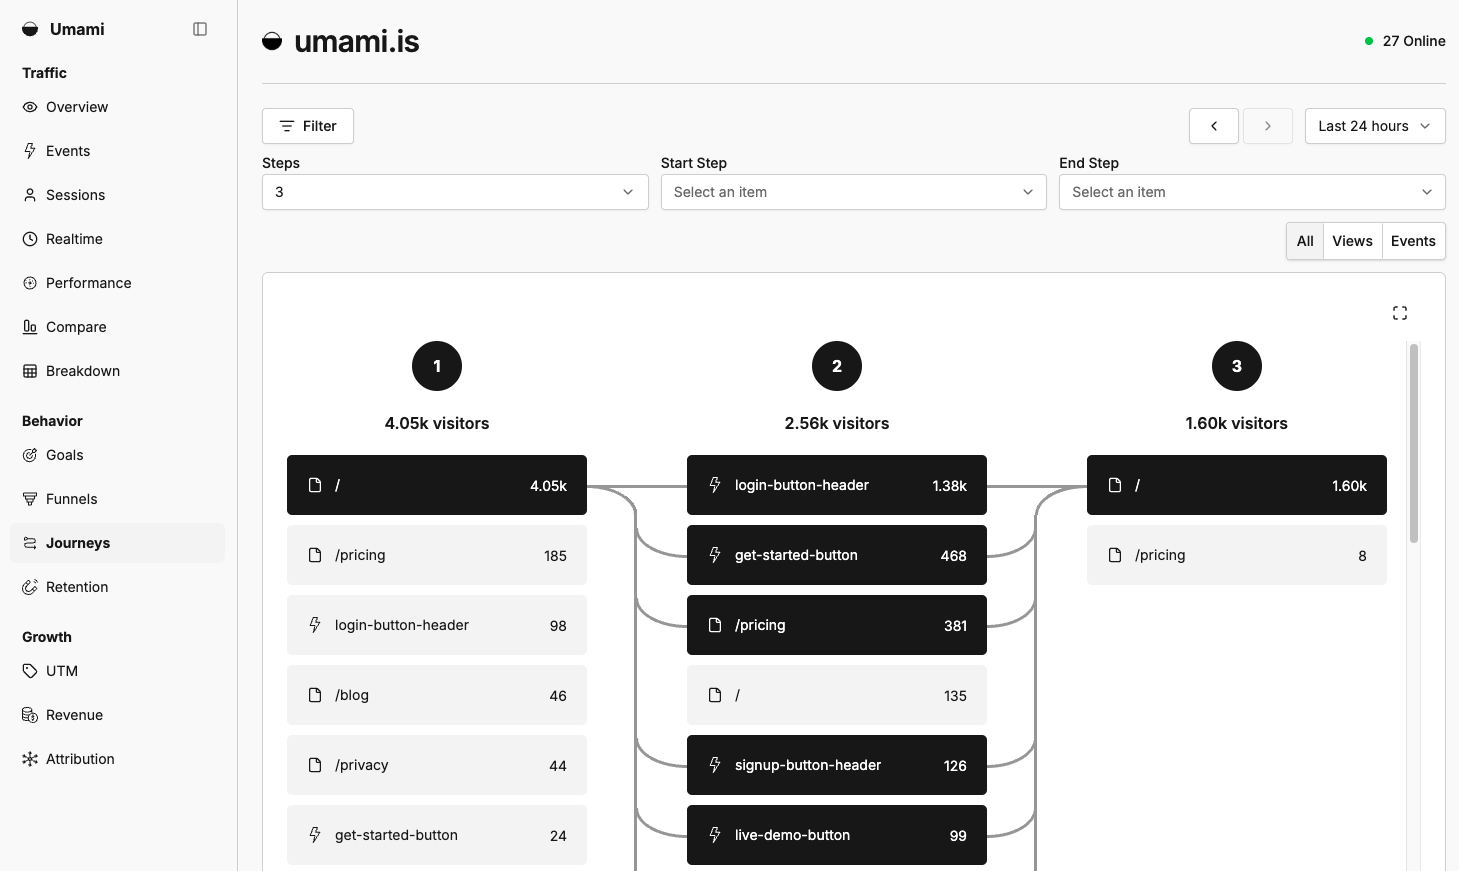
<p>Umami's Journeys report shows how visitors actually navigate through your website. That helps you understand what information people are looking for and what pages are critical for conversions to the next step.</p>
<p><img loading="lazy" src="https://www.debugbear.com/dimg/e0fa8a1d9ae8c5ed578cdc9b564efdf1.png" alt="Umami journeys report showing visitor paths across three steps" style="border-radius:4px" data-abc="true" class="img_CujE"></p>
<h2 class="anchor anchorWithStickyNavbar_FNw8" id="7-posthog">7. PostHog<a href="https://www.debugbear.com/software/best-web-analytics-tools#7-posthog" class="hash-link" aria-label="Direct link to 7. PostHog" title="Direct link to 7. PostHog">​</a></h2>
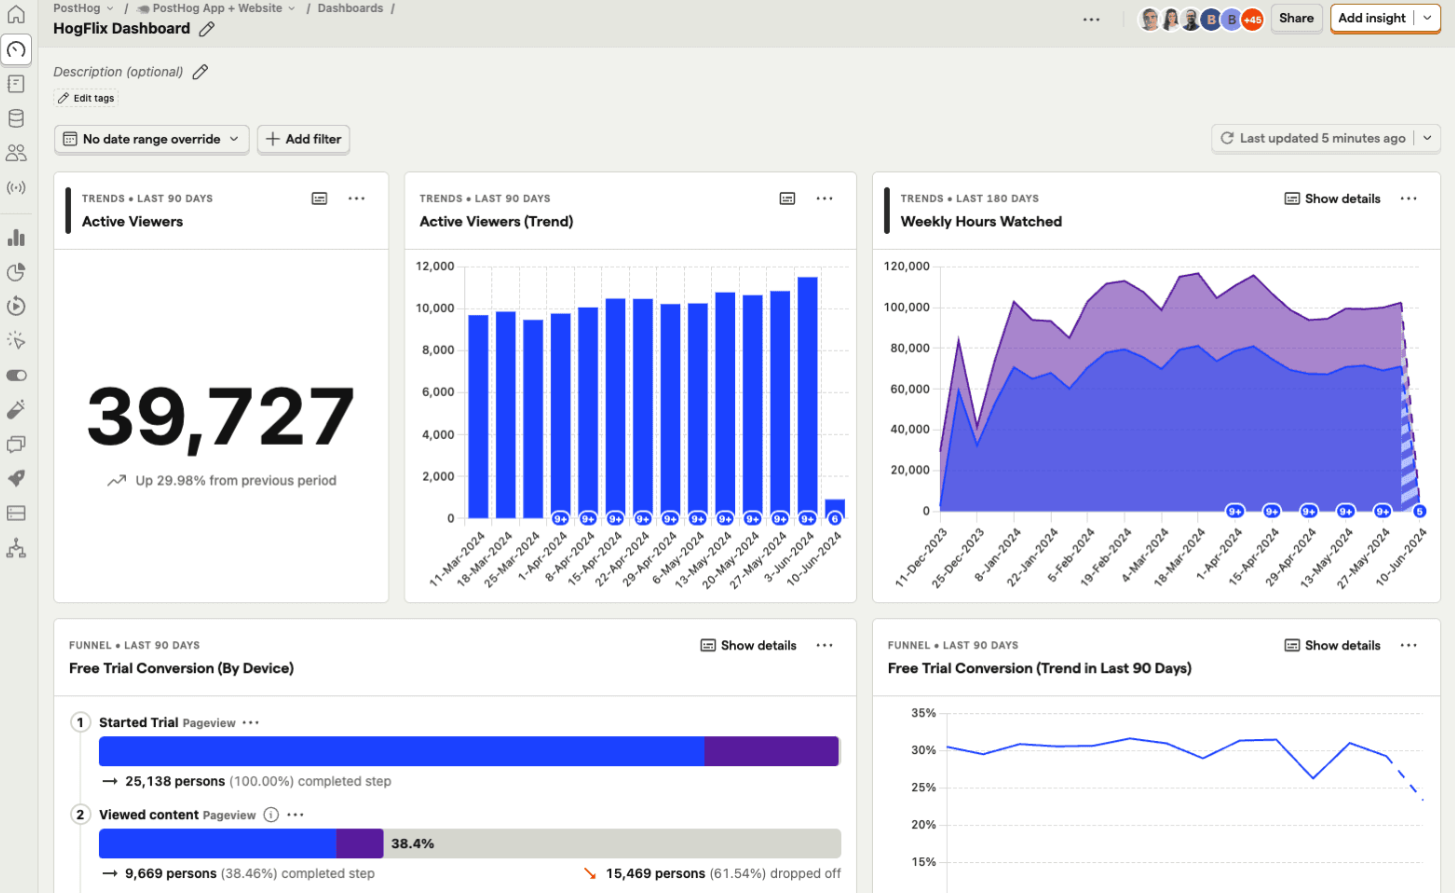
<p>PostHog is a product analytics platform that goes beyond simple web analytics. It's developer-focused, bundling session replay, error tracking, feature flags, A/B testing, and user surveys with the analytics product.</p>
<p>PostHog is open source and can be self-hosted. The hosted version has a generous free tier with usage-based pricing above that.</p>
<p><img loading="lazy" src="https://www.debugbear.com/dimg/73a9a25bfe95a49acadbf80c24c50dfc.png" alt="PostHog dashboard with active viewer trends and free trial conversion funnels" style="border-radius:4px" data-abc="true" class="img_CujE"></p>
<p>You get detailed insights into visitor sessions and behavior. PostHog provides AI-based analysis and can integrate with other data sources like Google Analytics or Stripe.</p>
<h2 class="anchor anchorWithStickyNavbar_FNw8" id="8-mixpanel">8. Mixpanel<a href="https://www.debugbear.com/software/best-web-analytics-tools#8-mixpanel" class="hash-link" aria-label="Direct link to 8. Mixpanel" title="Direct link to 8. Mixpanel">​</a></h2>
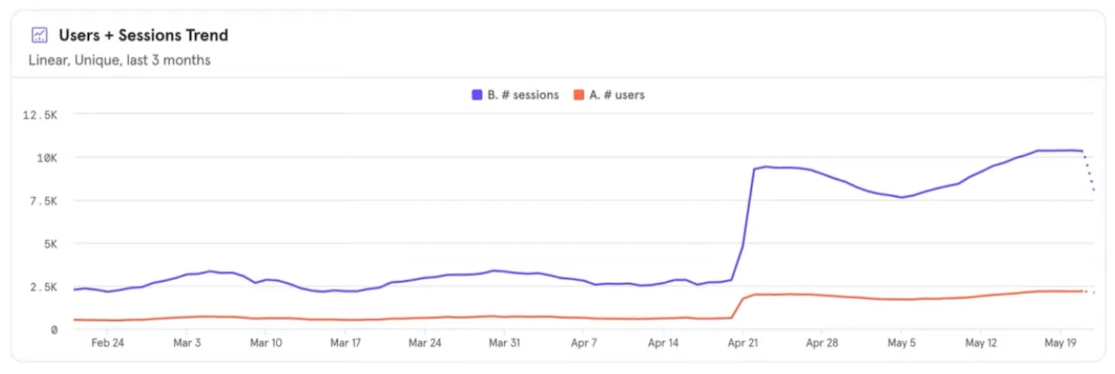
<p>Like PostHog, Mixpanel focuses on detailed product analytics rather than traffic reporting. It's the established choice for funnel analysis, retention reports, and cohort comparisons, and is often used alongside a separate tool for marketing website traffic.</p>
<p>You can report custom events, track user journeys, and compare different visitor cohorts. There's a free tier, with paid plans priced by event volume.</p>
<p><img loading="lazy" src="https://www.debugbear.com/dimg/6445d44b948aa65941d26f7fc1324692.png" alt="Mixpanel users and sessions trend chart" style="border-radius:4px" data-abc="true" class="img_CujE"></p>
<h2 class="anchor anchorWithStickyNavbar_FNw8" id="how-to-choose-a-web-analytics-tool">How to choose a web analytics tool<a href="https://www.debugbear.com/software/best-web-analytics-tools#how-to-choose-a-web-analytics-tool" class="hash-link" aria-label="Direct link to How to choose a web analytics tool" title="Direct link to How to choose a web analytics tool">​</a></h2>
<p>When choosing an analytics tool for your website, ask yourself:</p>
<ul>
<li>Do you need a simple tool or do you want to configure complex workflows?</li>
<li>Do you need just traffic analytics, or also product or web performance insights?</li>
<li>Who will use the product? Marketers, developers, or both?</li>
</ul>
<p>Plausible, Fathom, and Umami are great analytics tools for marketing websites where you mainly need traffic and conversion numbers.</p>
<p>DebugBear provides web analytics in a web performance context. That's great if you want to optimize the experience visitors have once they've landed on your website.</p>
<p>Google Analytics and Matomo are good for more established marketing teams that are willing to invest more into learning the tool and using its more advanced features.</p>
<p>PostHog or Mixpanel are good for more detailed and comprehensive insights, especially if you need data for your product as well as your marketing website.</p>
<h2 class="anchor anchorWithStickyNavbar_FNw8" id="collect-website-analytics-and-performance-data">Collect website analytics and performance data<a href="https://www.debugbear.com/software/best-web-analytics-tools#collect-website-analytics-and-performance-data" class="hash-link" aria-label="Direct link to Collect website analytics and performance data" title="Direct link to Collect website analytics and performance data">​</a></h2>
<p><a href="https://www.debugbear.com/">DebugBear</a> tells you about your visitors and how they experience your website. You can see where visitors come from, how fast your site loads for them, and what you can do to improve page speed and user interactions.</p>
<p>In addition to collecting real user visitor data, you can also run scheduled page speed tests and get alerted to performance regressions or website outages. <a href="https://www.debugbear.com/signup">Sign up for a free trial</a>.</p>
<p><img loading="lazy" src="https://www.debugbear.com/dimg/1e3b4e5e59c35d163d4e97a92cd48940.png" alt="DebugBear LCP dashboard" style="border-radius:4px" data-abc="true" class="img_CujE"></p>
<!-- -->
<div class="cta_Vy7l"><div class="ctaContainer_dzq8"><div class="ctaImage_MZ5b"><img src="https://www.debugbear.com/dimg/57001785e35454b95f43aa4f3bf6f857.png" alt="Illustration of website monitoring" class="themedComponent_mlkZ themedComponent--light_NVdE"><img src="https://www.debugbear.com/dimg/b2c0ae7a8dfbc4b18ba827a334c5c1af.png" alt="Illustration of website monitoring" class="themedComponent_mlkZ themedComponent--dark_xIcU"></div><div class="ctaContent_VgWi"><h2>Monitor Page Speed &amp; Core Web Vitals</h2><div class="ctaBenefits_OYw7"><h3>DebugBear monitoring includes:</h3><ul><li>In-depth Page Speed Reports</li><li>Automated Recommendations</li><li>Real User Analytics Data</li></ul></div><div><a href="https://www.debugbear.com/signup" class="ctaButton_Uos9 hidden-when-logged-in"><span>Start Free Trial</span></a><a href="https://www.debugbear.com/app" class="ctaButton_Uos9 visible-when-logged-in"><span>Go To App</span></a></div></div></div></div>]]></content>
        <author>
            <name>Matt Zeunert</name>
        </author>
    </entry>
    <entry>
        <title type="html"><![CDATA[Google Search Console: Track YouTube and Social Media in Search]]></title>
        <id>https://www.debugbear.com/software/google-search-console-youtube-social-media</id>
        <link href="https://www.debugbear.com/software/google-search-console-youtube-social-media"/>
        <updated>2026-08-11T00:00:00.000Z</updated>
        <summary type="html"><![CDATA[Google Search Console now lets you track how your YouTube, Instagram, TikTok, and X content performs in Google Search. This article explains how platform properties work.]]></summary>
        <content type="html"><![CDATA[<p><a href="https://www.debugbear.com/software/google-search-console-guide">Google Search Console</a> provides information on Google Search clicks and impressions for your website. But until recently, you couldn't use it to track data on websites you don't host yourself, like your social media pages.</p>
<p>That changed in July 2026 with platform properties, a new property type that shows how your YouTube and social media content performs in Google Search.</p>
<p>This article explains how to set up the new reports and what data they offer.</p>
<h2 class="anchor anchorWithStickyNavbar_FNw8" id="what-are-platform-properties">What are platform properties?<a href="https://www.debugbear.com/software/google-search-console-youtube-social-media#what-are-platform-properties" class="hash-link" aria-label="Direct link to What are platform properties?" title="Direct link to What are platform properties?">​</a></h2>
<p>Platform properties are a new Search Console feature that lets you see how your social media channels perform in Google Search.</p>
<p>The following platforms are supported:</p>
<ul>
<li>YouTube</li>
<li>Instagram</li>
<li>TikTok</li>
<li>X / Twitter</li>
</ul>
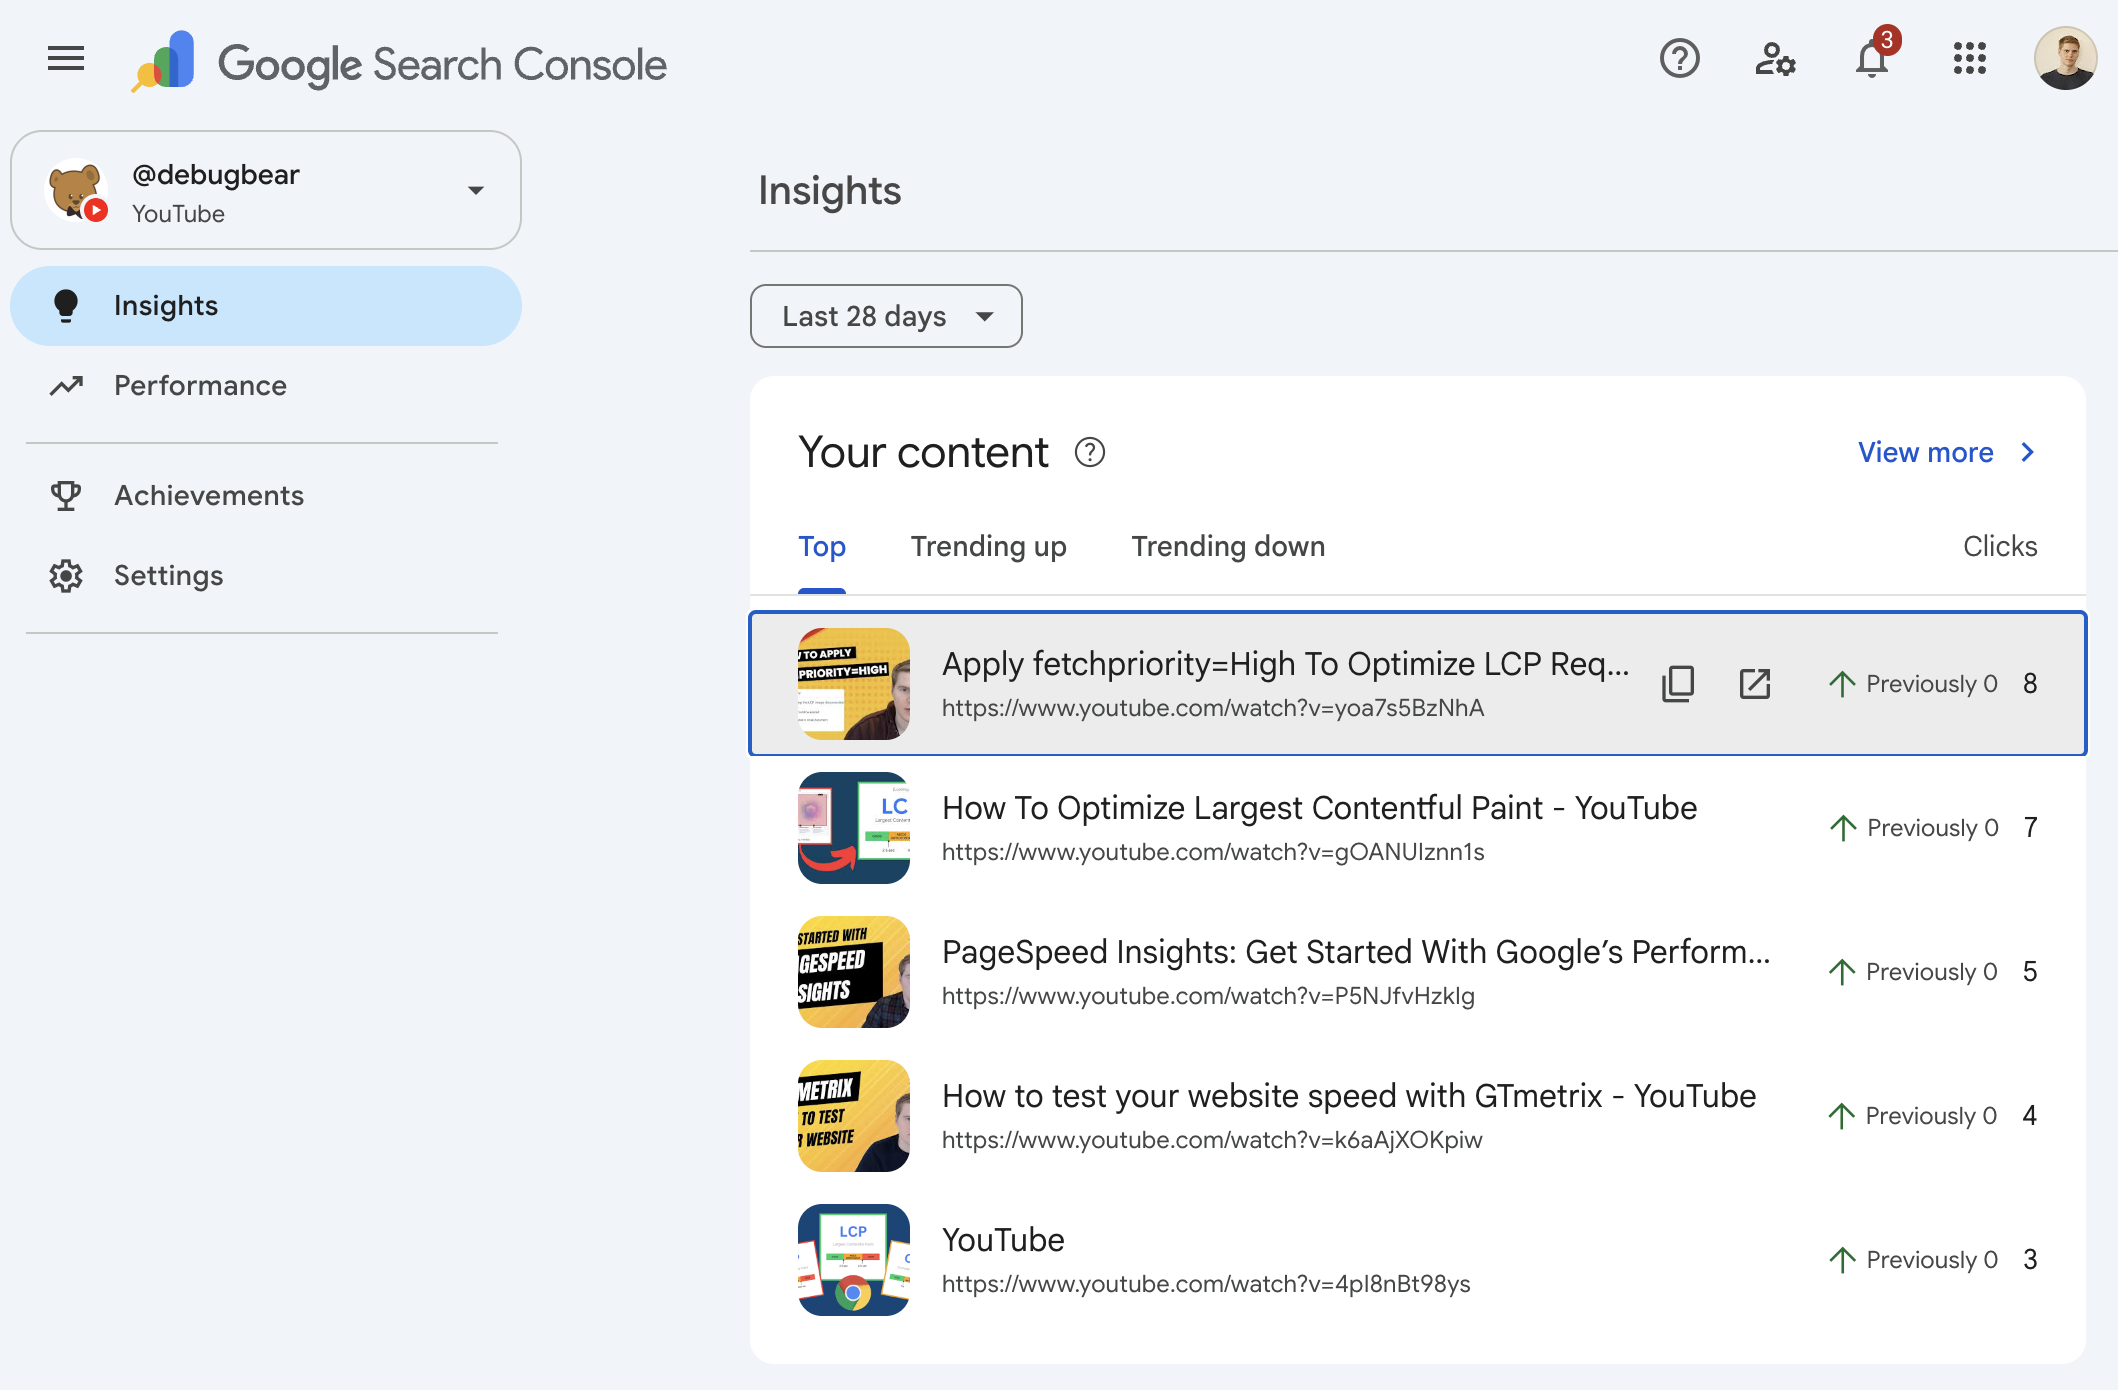
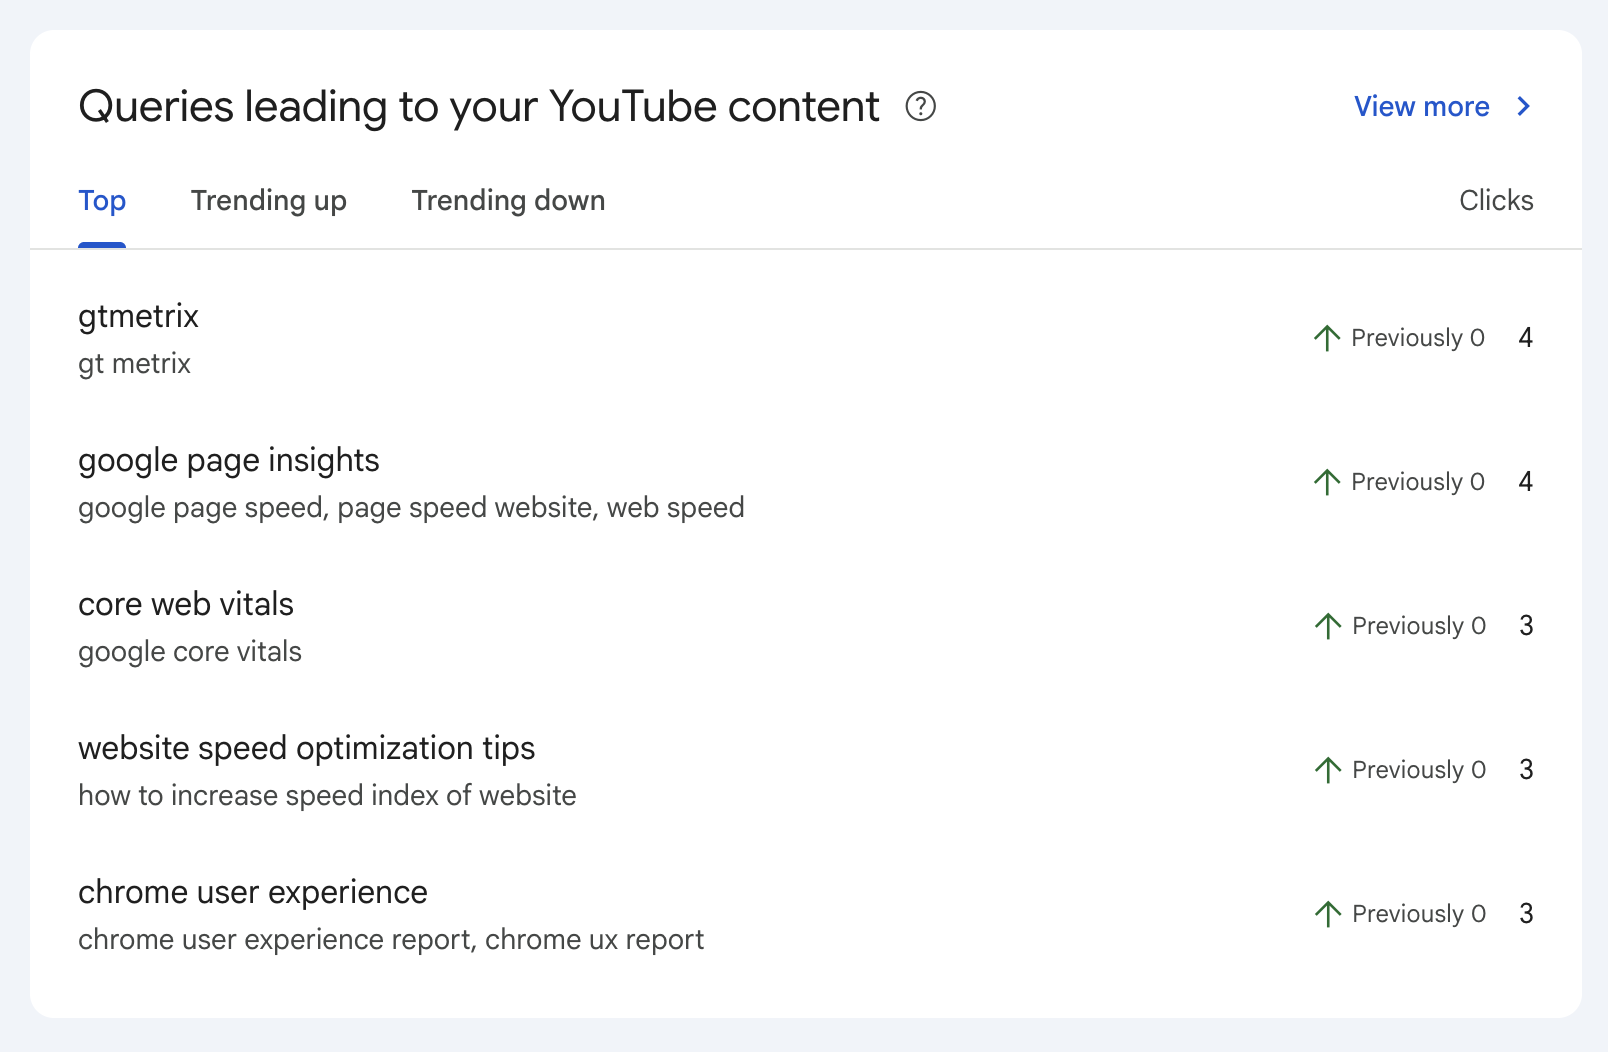
<p>For example, this screenshot shows trends in how viewers discover YouTube videos through Google Search.</p>
<p><img loading="lazy" src="https://www.debugbear.com/dimg/459314f6b793468d64bb8a5c9811f751.png" alt="Trending YouTube videos" style="border-radius:4px" data-abc="true" class="img_CujE"></p>
<h2 class="anchor anchorWithStickyNavbar_FNw8" id="how-to-set-up-a-social-media-platform-in-search-console">How to set up a social media platform in Search Console<a href="https://www.debugbear.com/software/google-search-console-youtube-social-media#how-to-set-up-a-social-media-platform-in-search-console" class="hash-link" aria-label="Direct link to How to set up a social media platform in Search Console" title="Direct link to How to set up a social media platform in Search Console">​</a></h2>
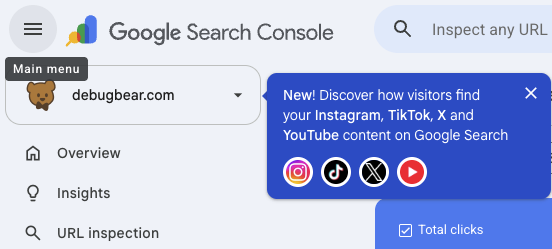
<p>Start by opening the property selector in the top right of Google Search Console.</p>
<p><img loading="lazy" src="https://www.debugbear.com/dimg/b10e4005c3b183eb45729c47bd459303.png" alt="Platform selection with new feature message" style="border-radius:4px" data-abc="true" class="img_CujE"></p>
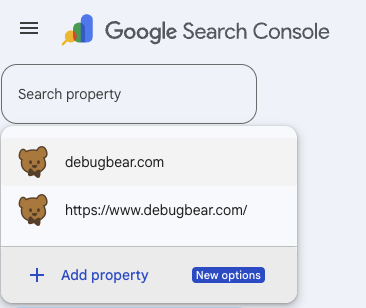
<p>Then select <strong>Add property</strong>.</p>
<p><img loading="lazy" src="https://www.debugbear.com/dimg/29d9b57a167abbe3ec450dfb9d804aae.png" alt="Open property dropdown" style="border-radius:4px" data-abc="true" class="img_CujE"></p>
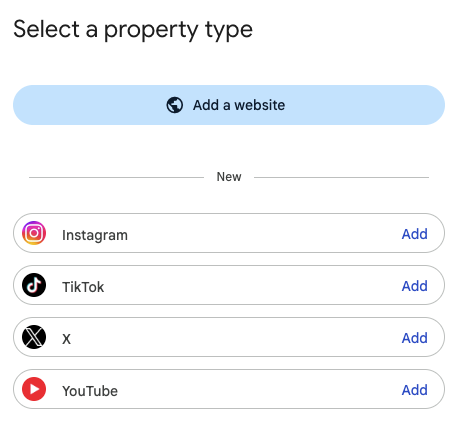
<p>You can add a new website or a supported social media platform. In this case, I'm adding a new YouTube channel.</p>
<p><img loading="lazy" src="https://www.debugbear.com/dimg/b0f62eb9553334f8b506f2b24eef1c27.png" alt="Selecting a property type" style="border-radius:4px" data-abc="true" class="img_CujE"></p>
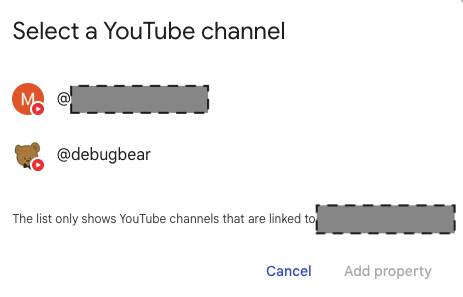
<p>Select which YouTube channel you want to connect and confirm it with <strong>Add property</strong>.</p>
<p><img loading="lazy" src="https://www.debugbear.com/dimg/a92d44ba096fc2425c446b51f299c87f.png" alt="YouTube channel selection" style="border-radius:4px" data-abc="true" class="img_CujE"></p>
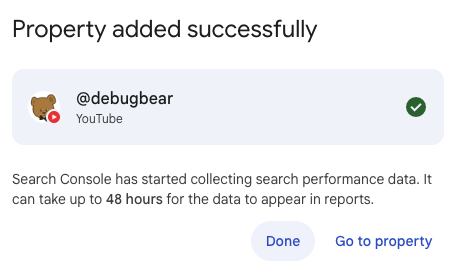
<p>The property has now been added successfully.</p>
<p>It will take a day or two before search analytics data is available.</p>
<p><img loading="lazy" src="https://www.debugbear.com/dimg/672b9db278d4d3a7cb0378a408854ed6.png" alt="Setup confirmation" style="border-radius:4px" data-abc="true" class="img_CujE"></p>
<h3 class="anchor anchorWithStickyNavbar_FNw8" id="x-and-other-non-google-accounts">X and other non-Google accounts<a href="https://www.debugbear.com/software/google-search-console-youtube-social-media#x-and-other-non-google-accounts" class="hash-link" aria-label="Direct link to X and other non-Google accounts" title="Direct link to X and other non-Google accounts">​</a></h3>
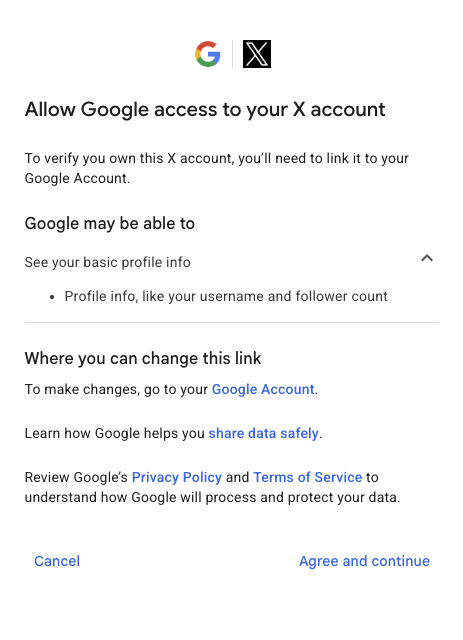
<p>When connecting your platform profile to Search Console, you'll need to authorize access on the platform.</p>
<p>You'll be able to see what data will be shared with Google.</p>
<p><img loading="lazy" src="https://www.debugbear.com/dimg/06e97a4d99c48decc8c09f244eea0e11.png" alt="X platform connection to Search Console" style="border-radius:4px" data-abc="true" class="img_CujE"></p>
<h2 class="anchor anchorWithStickyNavbar_FNw8" id="view-search-traffic-data-for-your-social-platform">View search traffic data for your social platform<a href="https://www.debugbear.com/software/google-search-console-youtube-social-media#view-search-traffic-data-for-your-social-platform" class="hash-link" aria-label="Direct link to View search traffic data for your social platform" title="Direct link to View search traffic data for your social platform">​</a></h2>
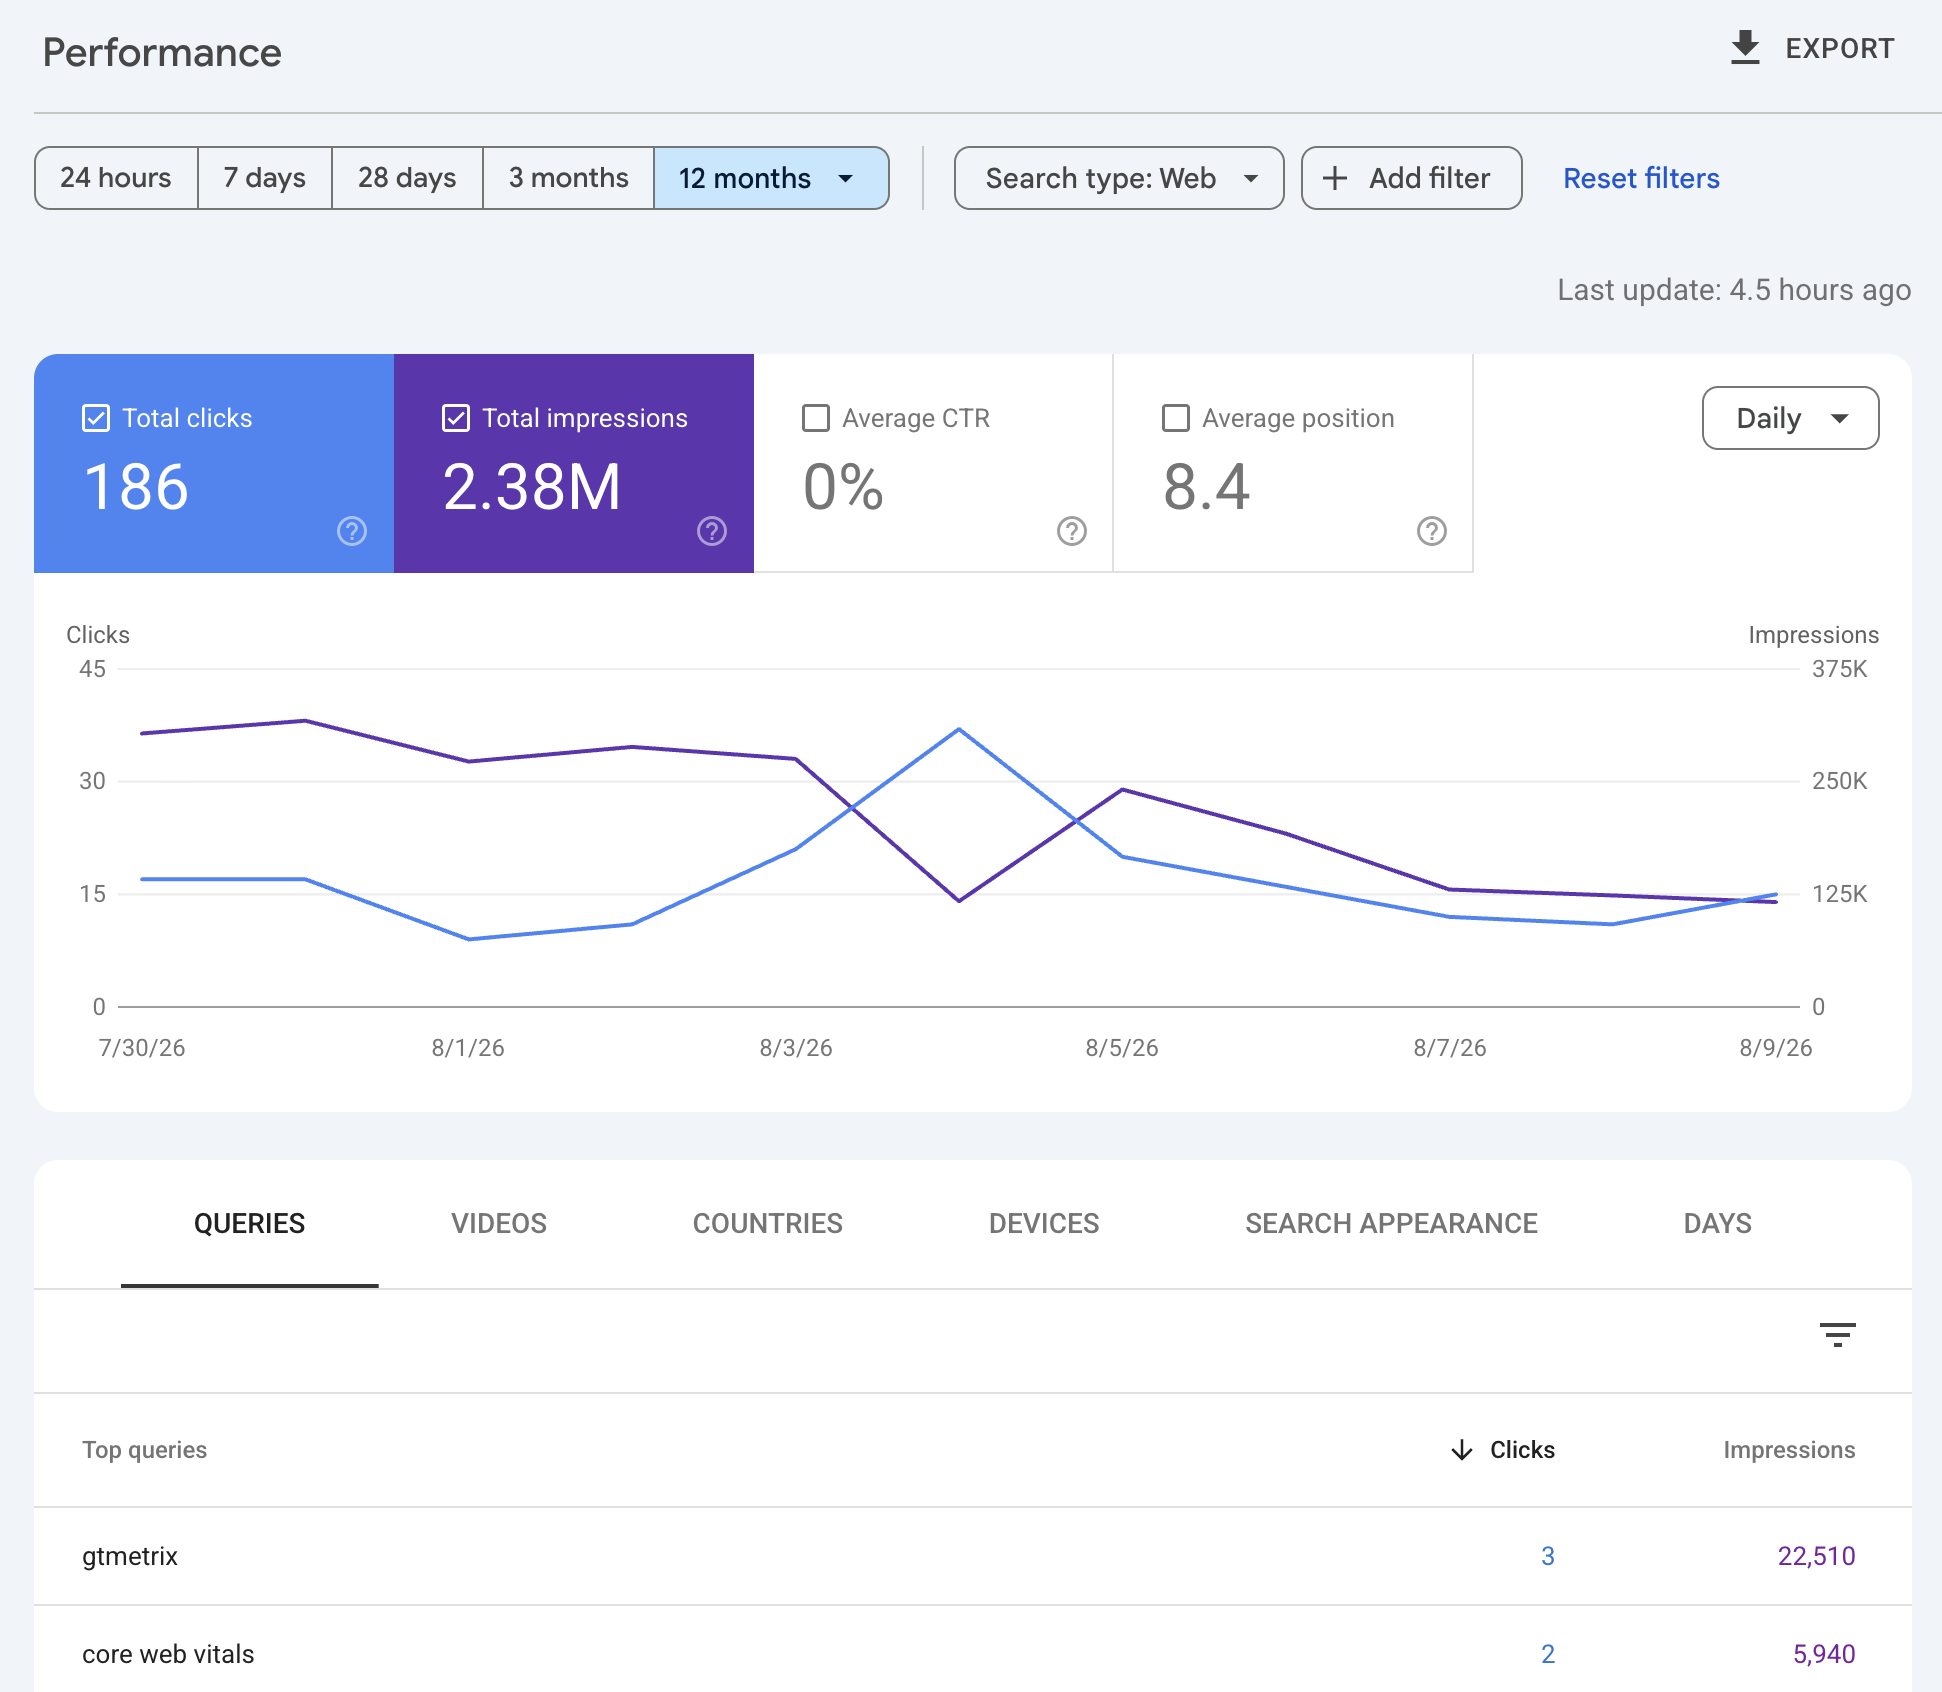
<p>Once the setup process is complete, you'll be able to access the usual search insights that Search Console provides, like keyword impressions or clicks.</p>
<p><img loading="lazy" src="https://www.debugbear.com/dimg/30ec2b41292f1fb9137b3115d9c6fdaf.png" alt="Search click and impressions data for YouTube" style="border-radius:4px" data-abc="true" class="img_CujE"></p>
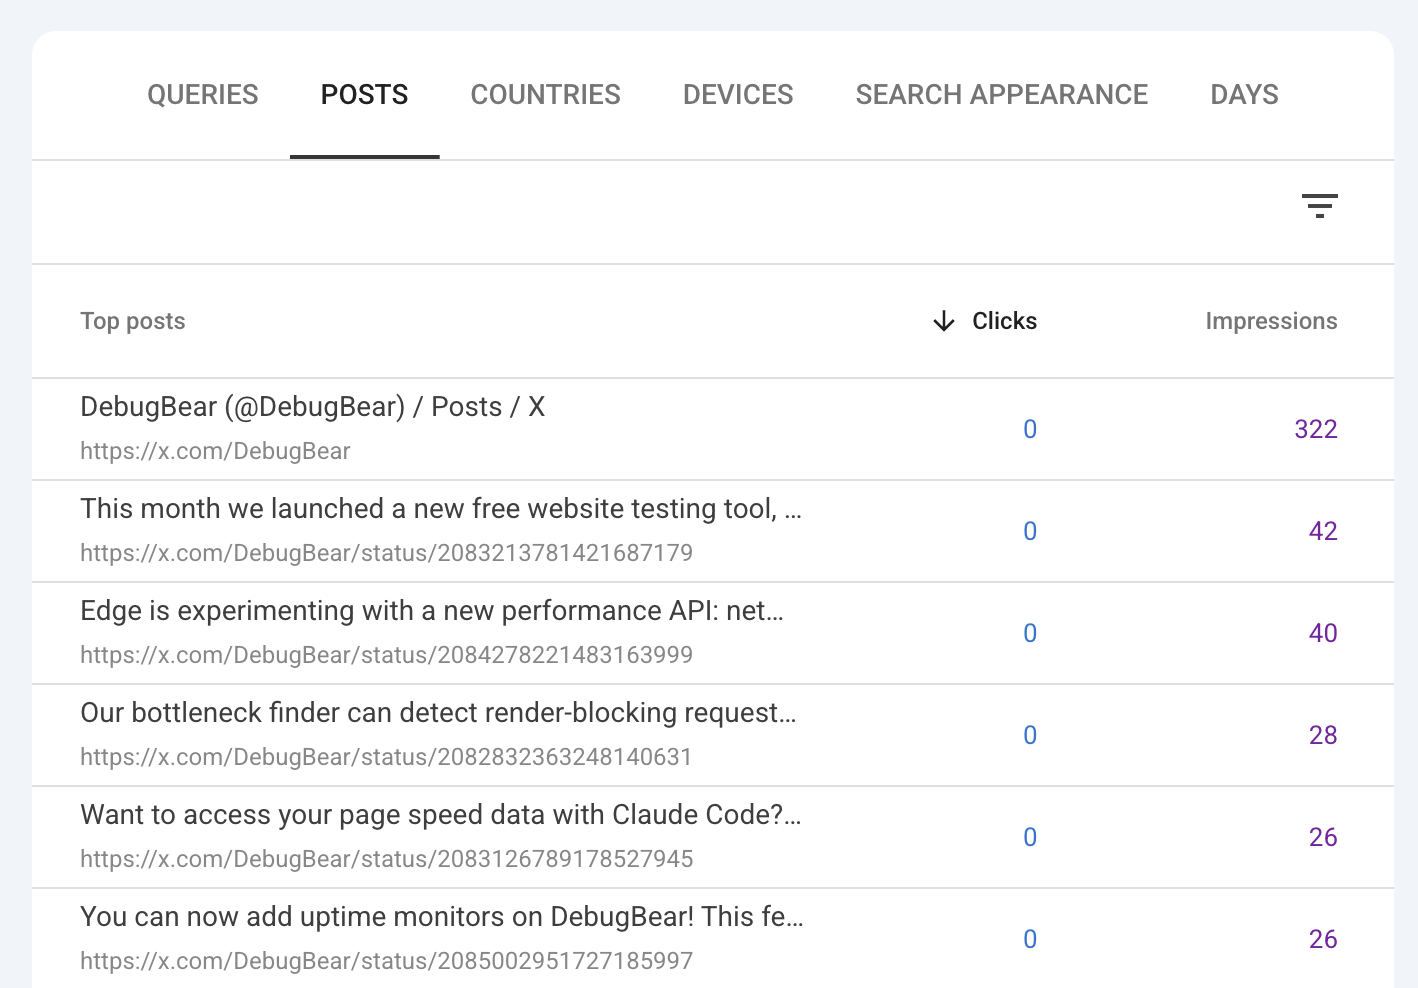
<p>Instead of the pages breakdown, you can access groupings based on the content type of the platform, for example X posts or YouTube videos.</p>
<p><img loading="lazy" src="https://www.debugbear.com/dimg/6c3d632dbdac270eaa3e05c6d7bf694e.png" alt="X posts by search impressions" style="border-radius:4px" data-abc="true" class="img_CujE"></p>
<p>The new insights reports are also available for platform properties. You can see trending content, keywords, and in what countries Google users are seeing your content.</p>
<p><img loading="lazy" src="https://www.debugbear.com/dimg/8bf7d95a5805208b086d267d7f4de52a.png" alt="YouTube keyword insights" style="border-radius:4px" data-abc="true" class="img_CujE"></p>
<h2 class="anchor anchorWithStickyNavbar_FNw8" id="limitations-of-platform-properties">Limitations of platform properties<a href="https://www.debugbear.com/software/google-search-console-youtube-social-media#limitations-of-platform-properties" class="hash-link" aria-label="Direct link to Limitations of platform properties" title="Direct link to Limitations of platform properties">​</a></h2>
<p>Platform property data is not as extensive as Google's website reports. That makes sense, since you don't have full control over the platform.</p>
<p>You also can't view data from before you've set up the platform. So you'll need to wait a few weeks to have more meaningful data for analysis.</p>]]></content>
        <author>
            <name>Matt Zeunert</name>
        </author>
    </entry>
    <entry>
        <title type="html"><![CDATA[The Best Uptime Monitoring Tools For 2026]]></title>
        <id>https://www.debugbear.com/software/best-uptime-monitoring-tools</id>
        <link href="https://www.debugbear.com/software/best-uptime-monitoring-tools"/>
        <updated>2026-07-26T00:00:00.000Z</updated>
        <summary type="html"><![CDATA[Compare the best uptime monitoring tools to track website availability and get alerted about downtime. We review 13 tools to help you choose the right one.]]></summary>
        <content type="html"><![CDATA[<p>Uptime monitoring tools help your business deliver your services reliably and inform customers about any incidents.</p>
<p>In this article we take a closer look at some of the different tools that are available on the market.</p>
<h2 class="anchor anchorWithStickyNavbar_FNw8" id="what-is-uptime-monitoring">What is uptime monitoring?<a href="https://www.debugbear.com/software/best-uptime-monitoring-tools#what-is-uptime-monitoring" class="hash-link" aria-label="Direct link to What is uptime monitoring?" title="Direct link to What is uptime monitoring?">​</a></h2>
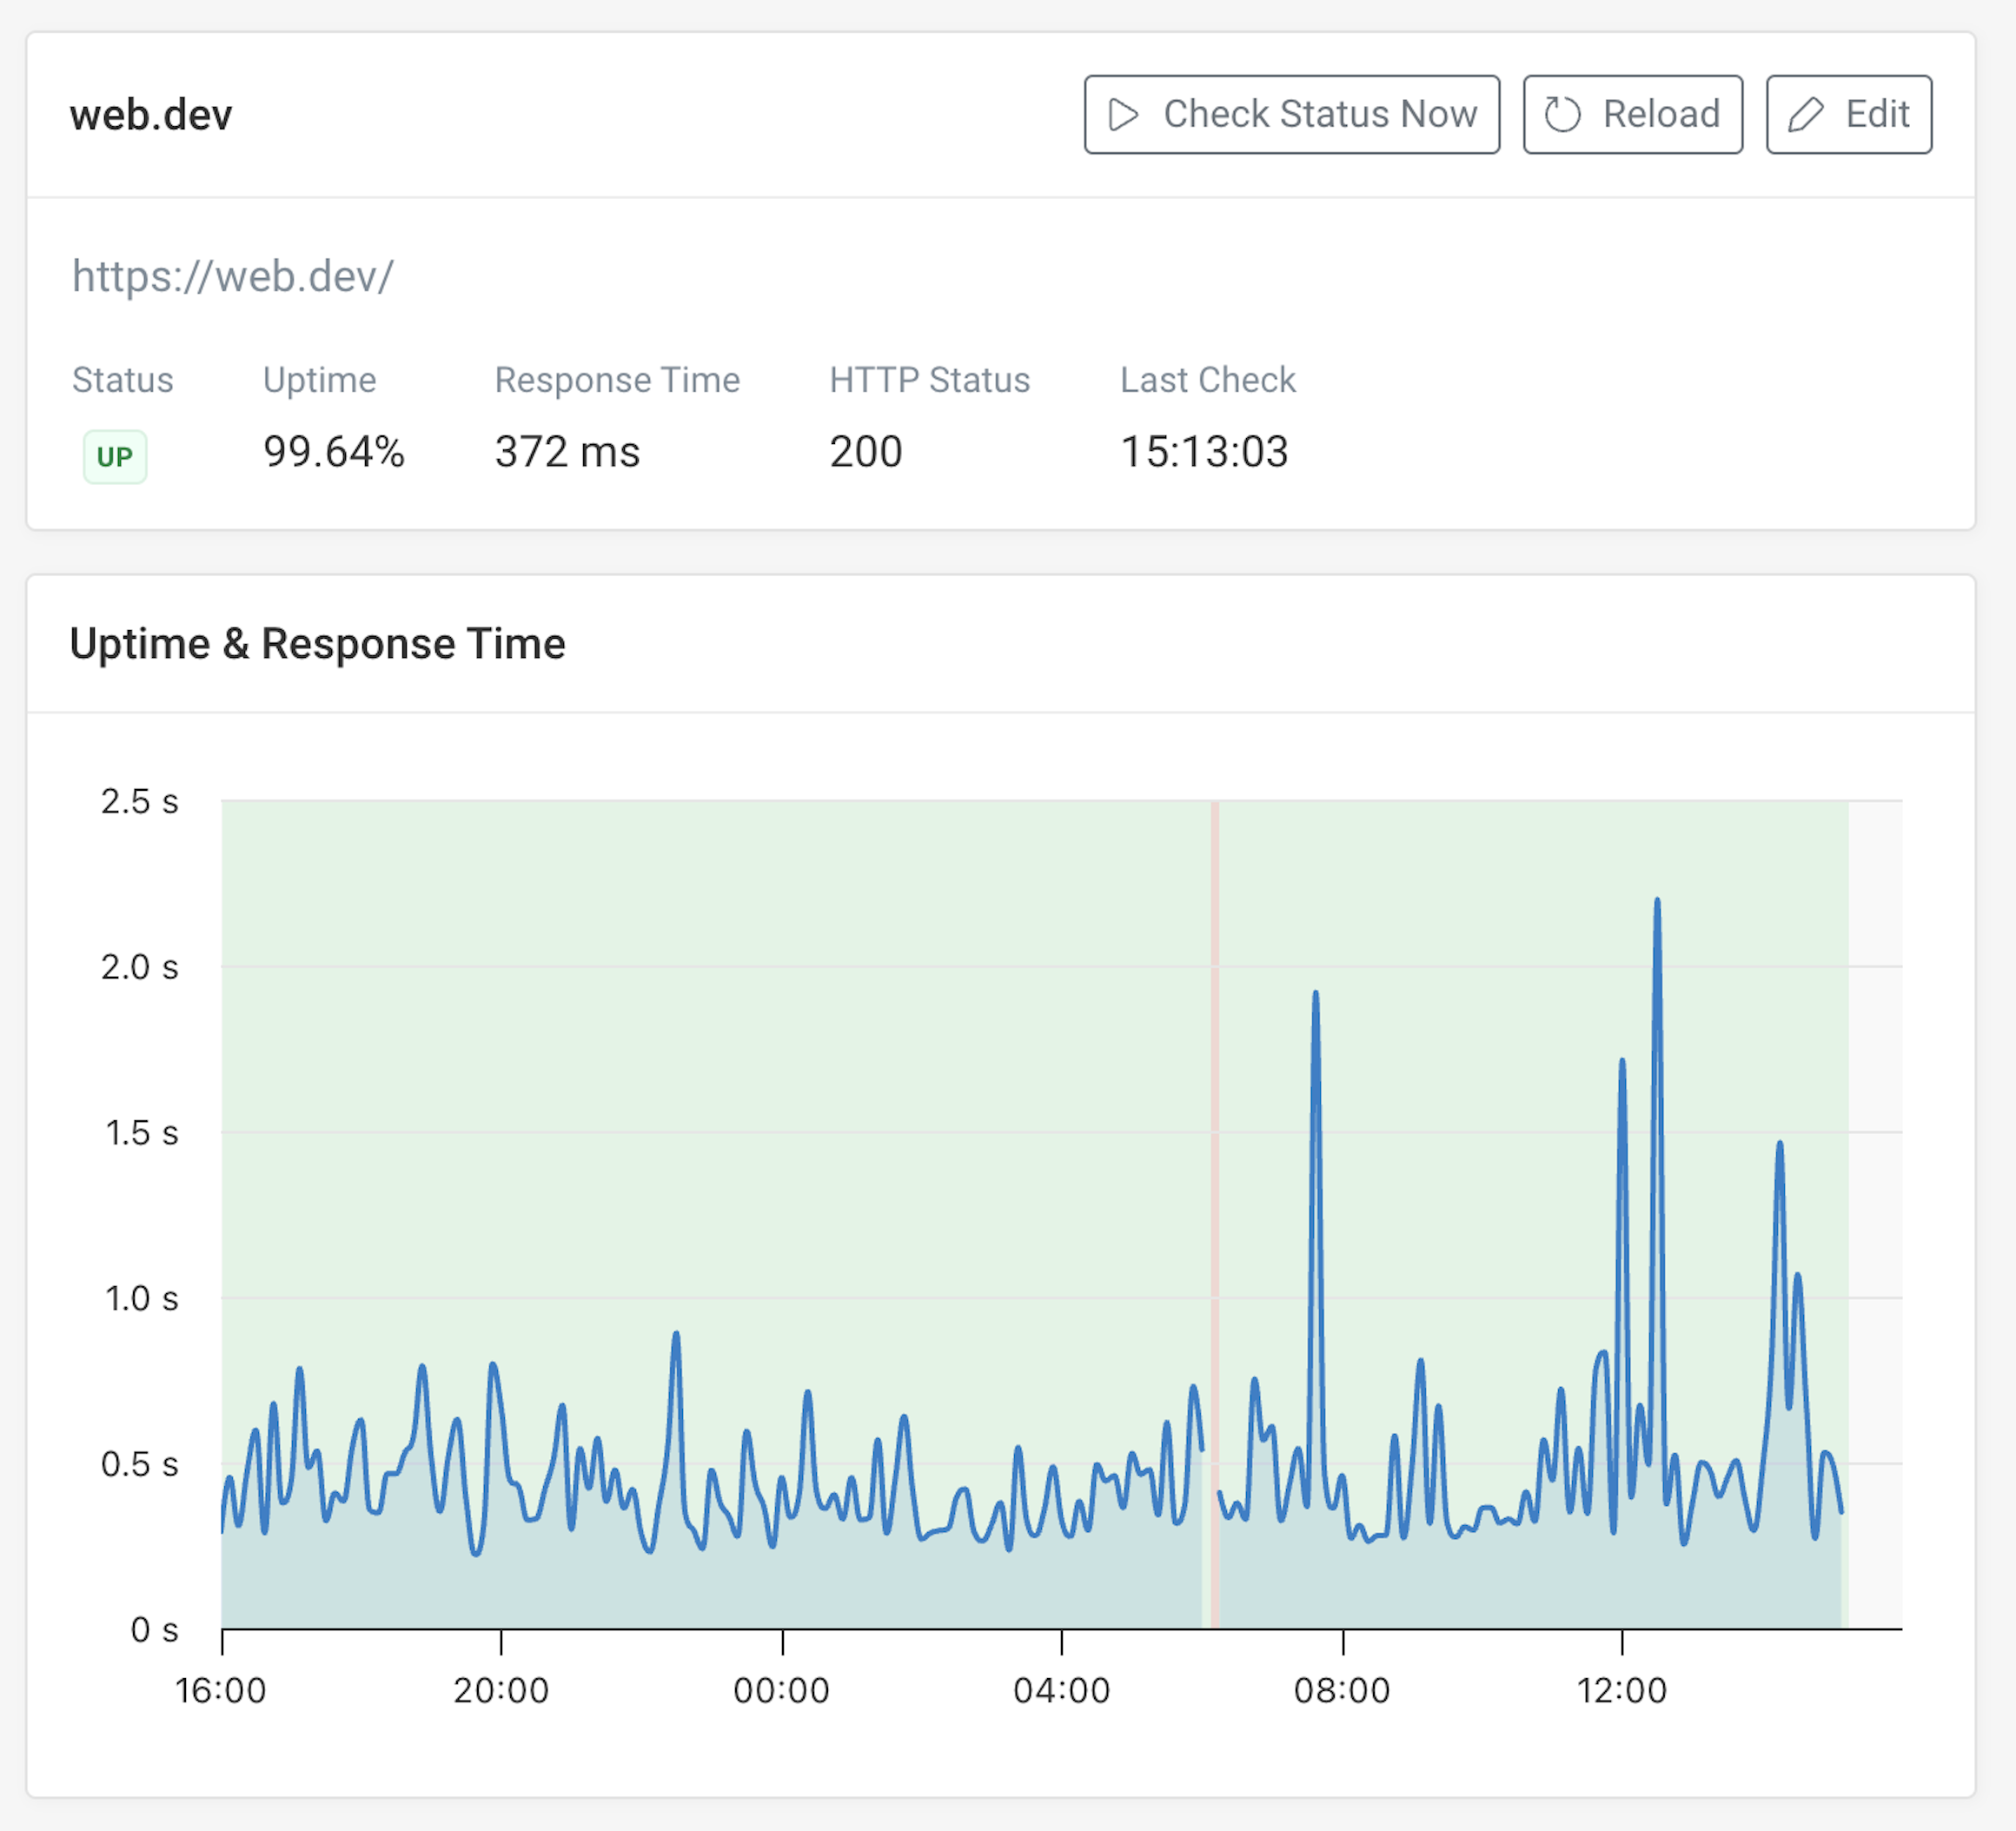
<p>Uptime or availability monitoring services continuously check whether your website is up or down, whether it works as expected or whether there's an outage.</p>
<p>For example, every minute you might make a request to your homepage URL to check if your server sends a valid response.</p>
<p>Based on this, the tools can then trigger an alert when there's an issue and notify your team. Some tools also offer additional features to set up custom status pages to keep your customers informed as well.</p>
<h3 class="anchor anchorWithStickyNavbar_FNw8" id="why-do-you-need-an-uptime-monitoring-tool">Why do you need an uptime monitoring tool?<a href="https://www.debugbear.com/software/best-uptime-monitoring-tools#why-do-you-need-an-uptime-monitoring-tool" class="hash-link" aria-label="Direct link to Why do you need an uptime monitoring tool?" title="Direct link to Why do you need an uptime monitoring tool?">​</a></h3>
<p>You don't want to find out about a broken website from your customers. Instead, proactive monitoring ensures that you can fix problems with minimal impact.</p>
<p>Uptime monitoring tools reduce the time from the start of an incident to when it is resolved.</p>
<h2 class="anchor anchorWithStickyNavbar_FNw8" id="1-debugbear">1. DebugBear<a href="https://www.debugbear.com/software/best-uptime-monitoring-tools#1-debugbear" class="hash-link" aria-label="Direct link to 1. DebugBear" title="Direct link to 1. DebugBear">​</a></h2>
<p><a href="https://www.debugbear.com/">DebugBear</a> combines uptime monitoring with in-depth website performance monitoring. Instead of only telling you whether your site is up, it also tells you how fast it is for your visitors and what's slowing it down.</p>
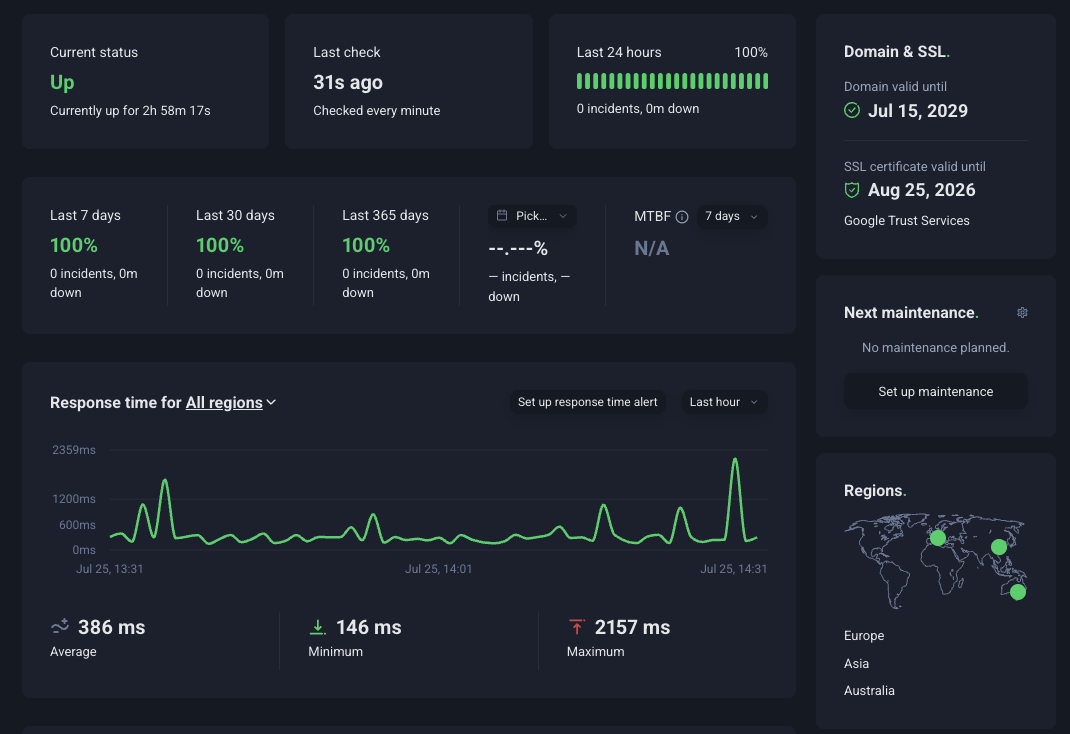
<p>You can check your website availability every minute and get alerted to outages.</p>
<p><img loading="lazy" src="https://www.debugbear.com/dimg/9d089ec76bfb1b81e0a11a1755f9ddfe.png" alt="Website monitoring data for Core Web Vitals" style="border-radius:4px" data-abc="true" class="img_CujE"></p>
<p>On top of checking the status code of your server response, DebugBear can also fail checks based on slow server response times, missing HTTP response headers, or missing keywords in the response body.</p>
<p>You can sign up for a <a href="https://www.debugbear.com/signup">free trial</a>, with paid plans starting at $49 a month.</p>
<h2 class="anchor anchorWithStickyNavbar_FNw8" id="2-uptimerobot">2. UptimeRobot<a href="https://www.debugbear.com/software/best-uptime-monitoring-tools#2-uptimerobot" class="hash-link" aria-label="Direct link to 2. UptimeRobot" title="Direct link to 2. UptimeRobot">​</a></h2>
<p>UptimeRobot is a focused tool aimed at ensuring website availability. It provides a number of different types of uptime monitoring, and does not stray into page speed checks, transaction monitoring, or visitor analytics.</p>
<p>You can also create public status pages to communicate uptime and incidents to customers.</p>
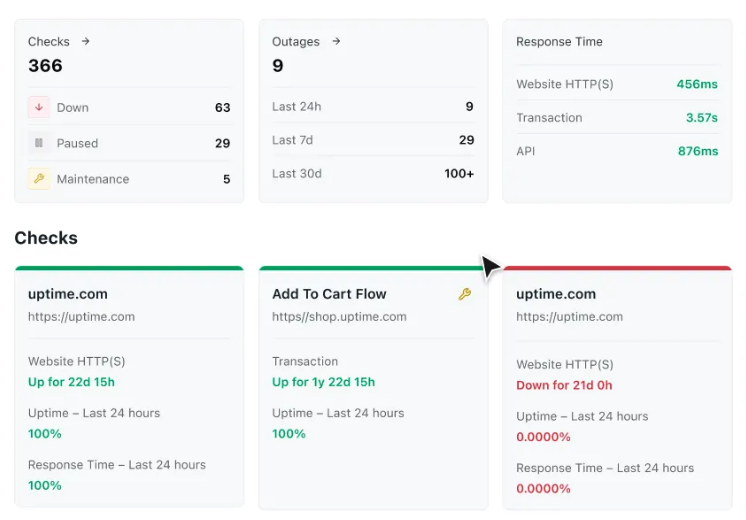
<p><img loading="lazy" src="https://www.debugbear.com/dimg/a9f92f364b3c3adae651ba1d0ce3fb99.png" alt="UptimeRobot dashboard" style="border-radius:4px" data-abc="true" class="img_CujE"></p>
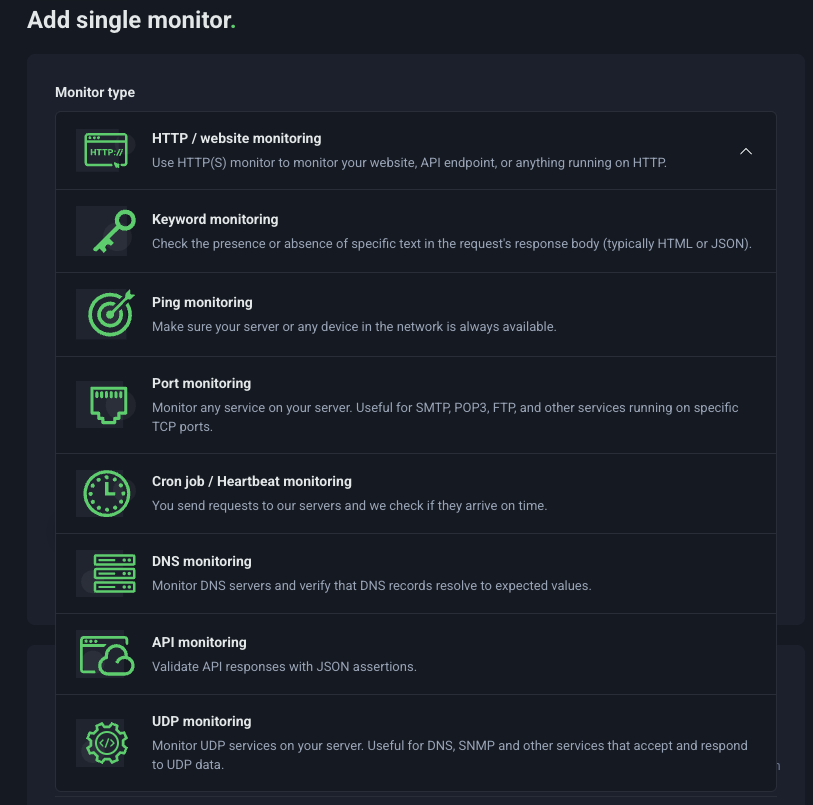
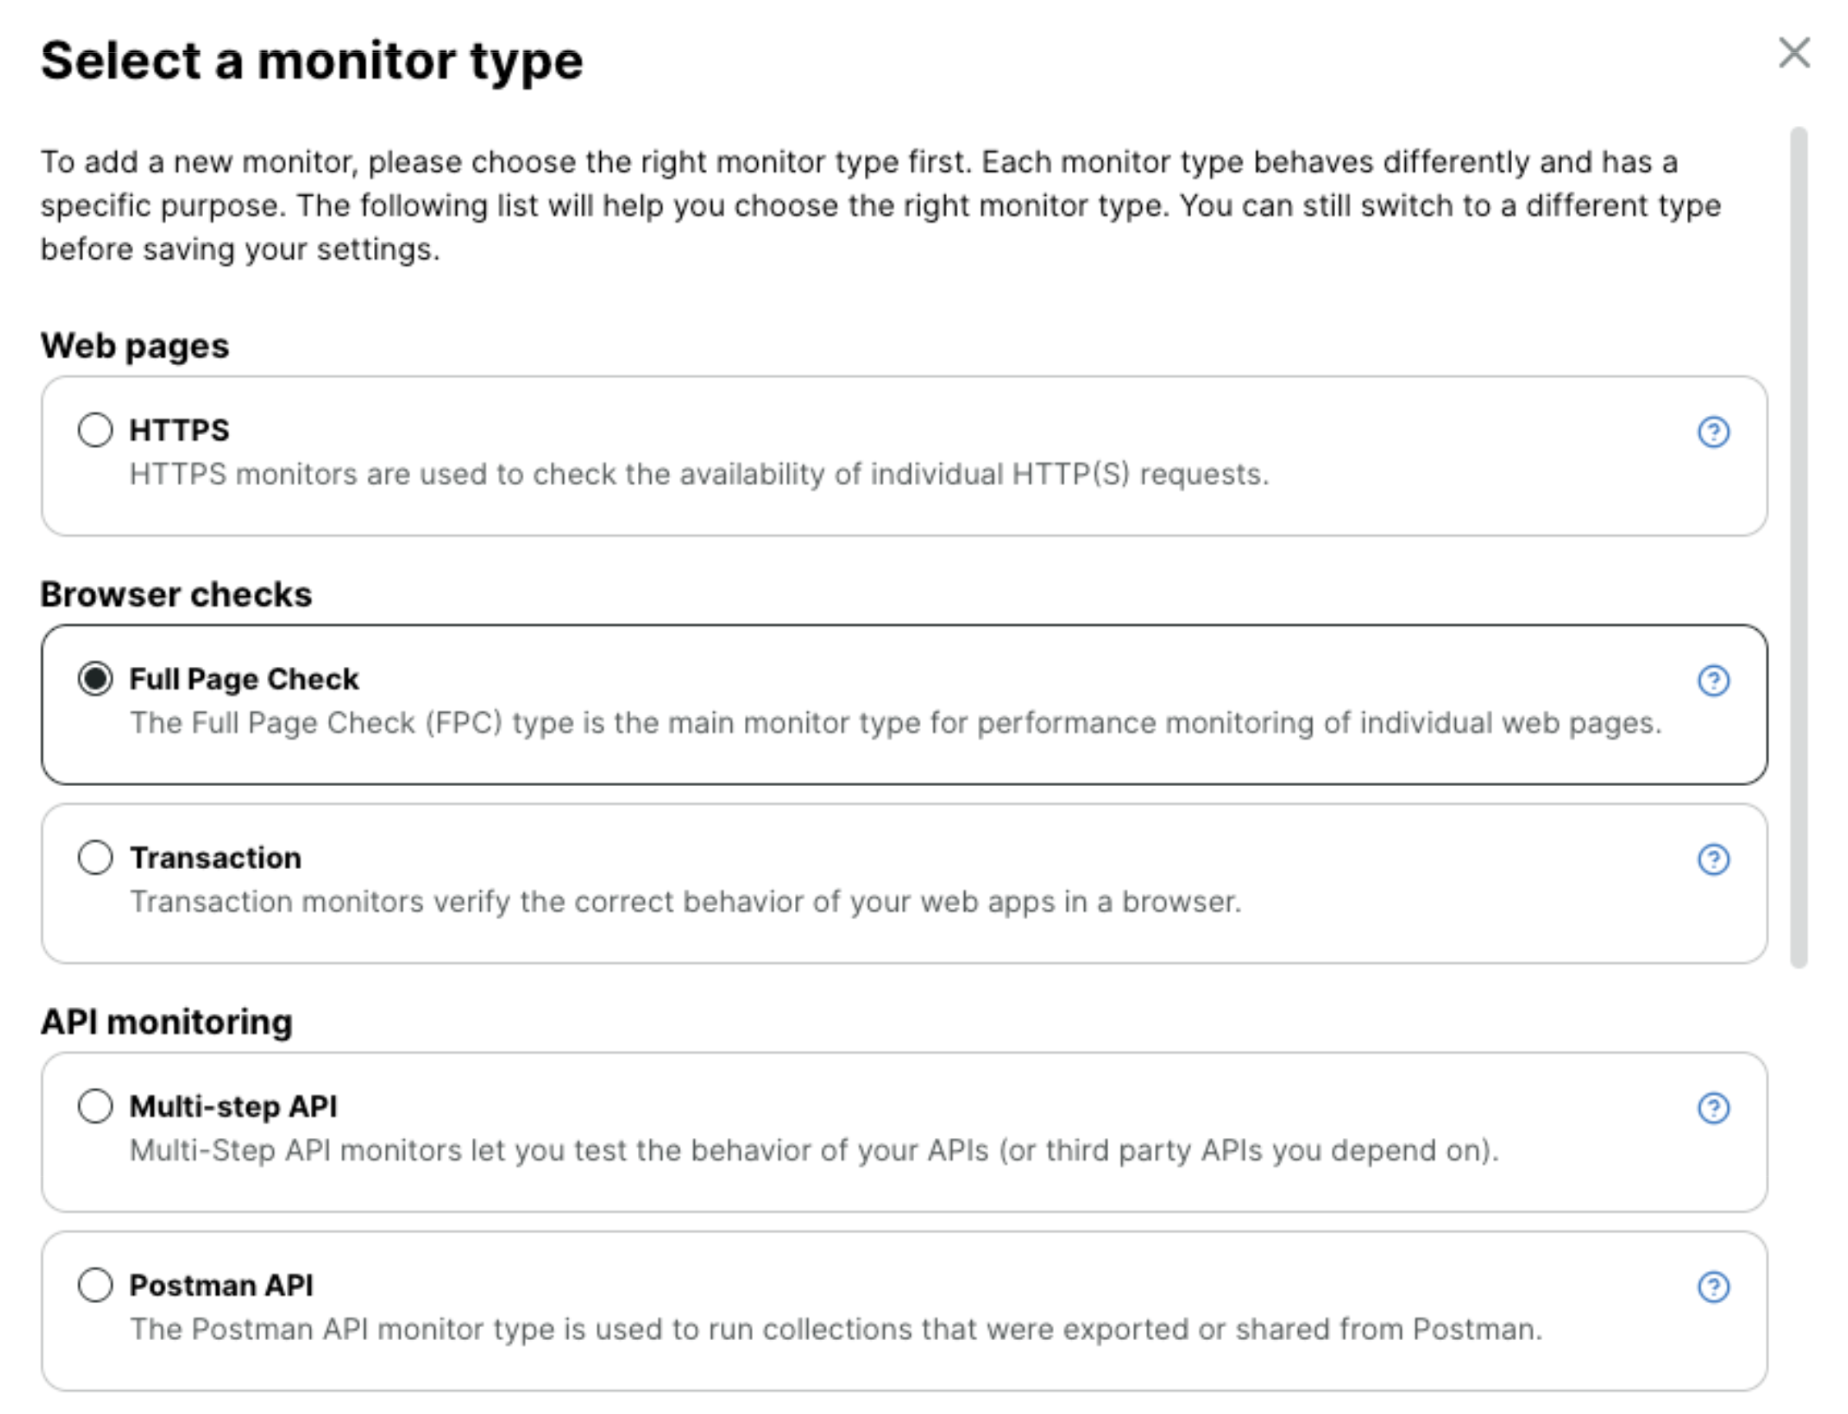
<p>Creating a monitor is easy, just pick the type of monitor you want to create and specify the target URL.</p>
<p>You can run HTTP checks on your website, confirm that a page contains specific keywords, test server availability, monitor DNS, and more.</p>
<p><img loading="lazy" src="https://www.debugbear.com/dimg/d170139911e9073c957484e6290e24e5.png" alt="UptimeRobot monitoring types" style="border-radius:4px" data-abc="true" class="img_CujE"></p>
<p>UptimeRobot offers a free plan, with paid plans starting at €9 a month.</p>
<h2 class="anchor anchorWithStickyNavbar_FNw8" id="3-pingdom">3. Pingdom<a href="https://www.debugbear.com/software/best-uptime-monitoring-tools#3-pingdom" class="hash-link" aria-label="Direct link to 3. Pingdom" title="Direct link to 3. Pingdom">​</a></h2>
<p>Pingdom by SolarWinds is a comprehensive website monitoring product that doesn't just let you monitor uptime but also page speed, website transactions, and real user visits.</p>
<p>You can then configure custom alerts to get notified via email, SMS, or through various incident management products.</p>
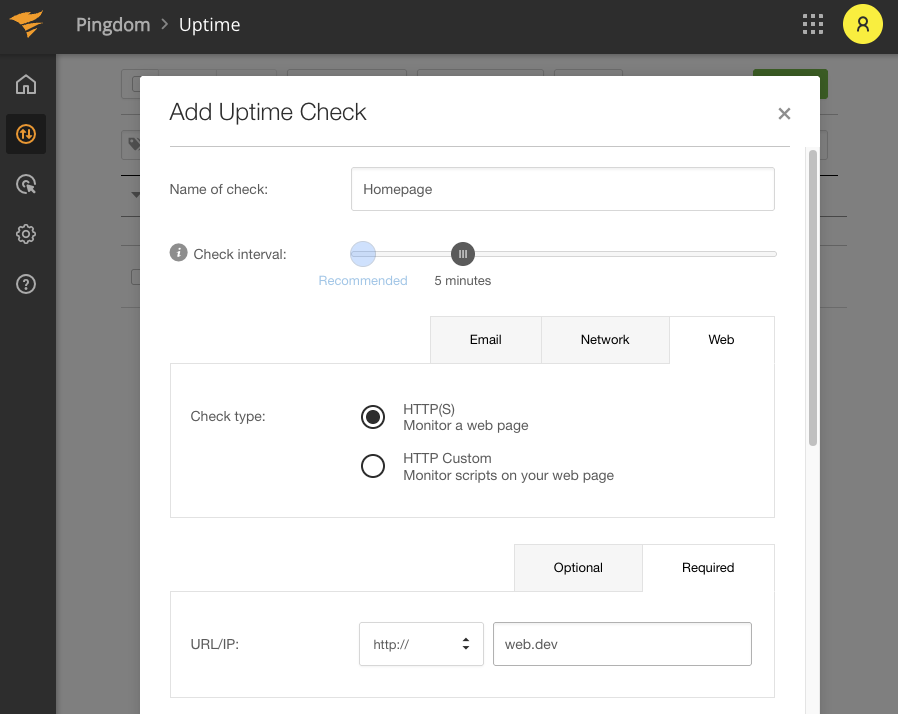
<p><img loading="lazy" src="https://www.debugbear.com/dimg/f4f9f62d057b77864e17835ac4c20a8c.png" alt="Pingdom uptime check setup" style="border-radius:4px" data-abc="true" class="img_CujE"></p>
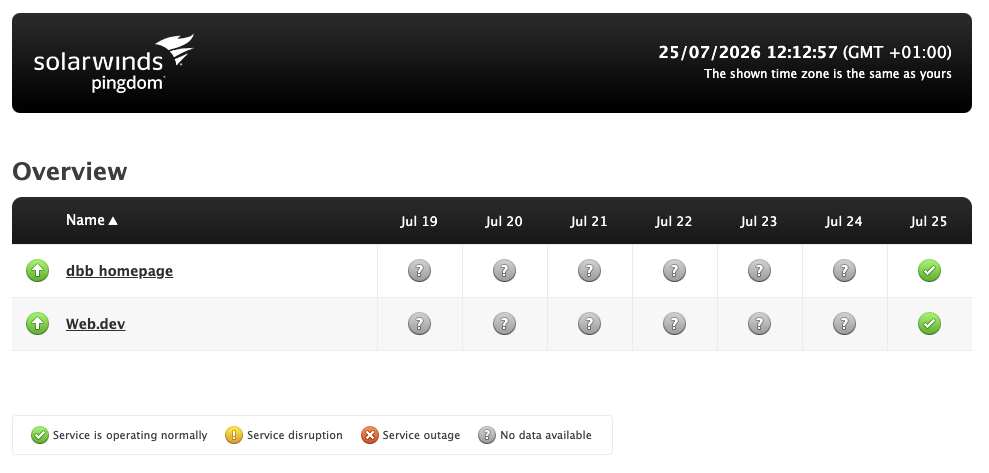
<p>Set up custom status pages to keep your customers up to date with service updates and information on ongoing incidents. However, you can't post manual status updates on active alerts.</p>
<p>Pricing starts at $16.50 for 10 monitors. 100 monitors cost $136.</p>
<p><img loading="lazy" src="https://www.debugbear.com/dimg/933a0547995cd9fc28bcc5d4ca69c92a.png" alt="Pingdom status page" style="border-radius:4px" data-abc="true" class="img_CujE"></p>
<h2 class="anchor anchorWithStickyNavbar_FNw8" id="4-statuscake">4. StatusCake<a href="https://www.debugbear.com/software/best-uptime-monitoring-tools#4-statuscake" class="hash-link" aria-label="Direct link to 4. StatusCake" title="Direct link to 4. StatusCake">​</a></h2>
<p>StatusCake lets you monitor website uptime and page speed. You can get alerted to outages and publish public status pages to inform users.</p>
<p><img loading="lazy" src="https://www.debugbear.com/dimg/1b1ec88ba081e9b1fb030c688558fa3d.png" alt="StatusCake monitor" style="border-radius:4px" data-abc="true" class="img_CujE"></p>
<p>You can pick from a number of different alerting integrations, like Slack, Microsoft Teams, or PagerDuty. StatusCake can also call or text you.</p>
<p>There's a free plan and paid options start from $12.49 a month for up to 100 uptime monitors.</p>
<p><img loading="lazy" src="https://www.debugbear.com/dimg/9e46adc7205cd8b5f1a3776f8bc0f614.png" alt="StatusCake integration options" style="border-radius:4px" data-abc="true" class="img_CujE"></p>
<h2 class="anchor anchorWithStickyNavbar_FNw8" id="5-site24x7">5. Site24x7<a href="https://www.debugbear.com/software/best-uptime-monitoring-tools#5-site24x7" class="hash-link" aria-label="Direct link to 5. Site24x7" title="Direct link to 5. Site24x7">​</a></h2>
<p>ManageEngine Site24x7, owned by Zoho, is a digital experience monitoring solution that provides both website and infrastructure monitoring.</p>
<p>It offers an especially large number of monitor types.</p>
<p><img loading="lazy" src="https://www.debugbear.com/dimg/95f558511430cfdb11d25214216ad648.png" alt="Site24x7 monitoring types" style="border-radius:4px" data-abc="true" class="img_CujE"></p>
<p>Create a website monitoring check to start continuously testing availability. You need to pick a name, website URL, check frequency, and monitoring location.</p>
<p><img loading="lazy" src="https://www.debugbear.com/dimg/464d1a85ecfccc6d3fdee78fc6bae469.png" alt="Status monitoring data in Site24x7" style="border-radius:4px" data-abc="true" class="img_CujE"></p>
<p>Site24x7 also lets you configure specific assertions, like whether the server response contains a certain string or if a specific header is returned.</p>
<p>Pricing starts from $9 a month for 10 monitors.</p>
<p><img loading="lazy" src="https://www.debugbear.com/dimg/dc4aeff3bccf5e451fd5ac413cfb87b2.png" alt="Site24x7 content checks" style="border-radius:4px" data-abc="true" class="img_CujE"></p>
<h2 class="anchor anchorWithStickyNavbar_FNw8" id="6-uptimecom">6. Uptime.com<a href="https://www.debugbear.com/software/best-uptime-monitoring-tools#6-uptimecom" class="hash-link" aria-label="Direct link to 6. Uptime.com" title="Direct link to 6. Uptime.com">​</a></h2>
<p>Uptime checks that your website functions reliably by providing a comprehensive platform to monitor your website status and communicate it to customers.</p>
<p>On top of uptime checks you can also collect page speed data based on both synthetic tests and real user monitoring.</p>
<p>Paid plans start from $7 per month.</p>
<p><img loading="lazy" src="https://www.debugbear.com/dimg/f32d4147e8ab21048c28eb6e17180001.png" alt="Uptime.com dashboard" style="border-radius:4px" data-abc="true" class="img_CujE"></p>
<h2 class="anchor anchorWithStickyNavbar_FNw8" id="7-checkly">7. Checkly<a href="https://www.debugbear.com/software/best-uptime-monitoring-tools#7-checkly" class="hash-link" aria-label="Direct link to 7. Checkly" title="Direct link to 7. Checkly">​</a></h2>
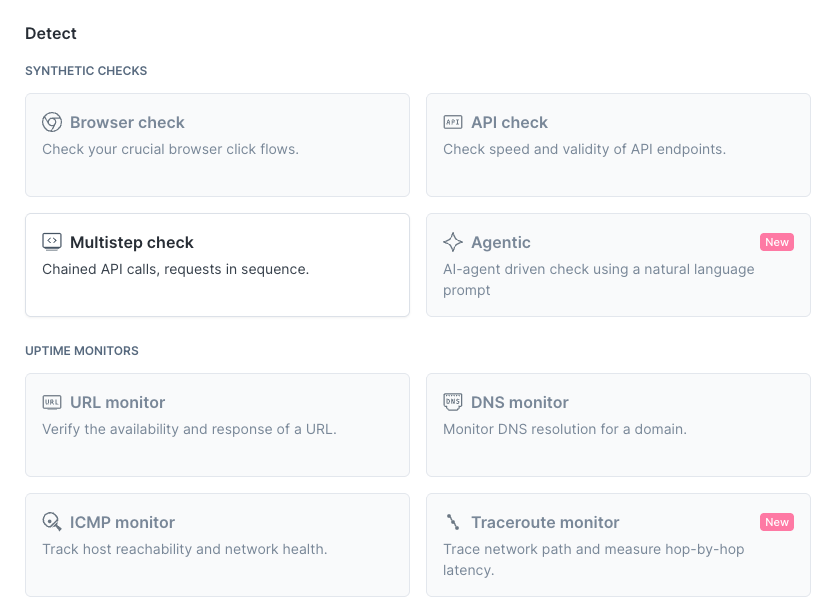
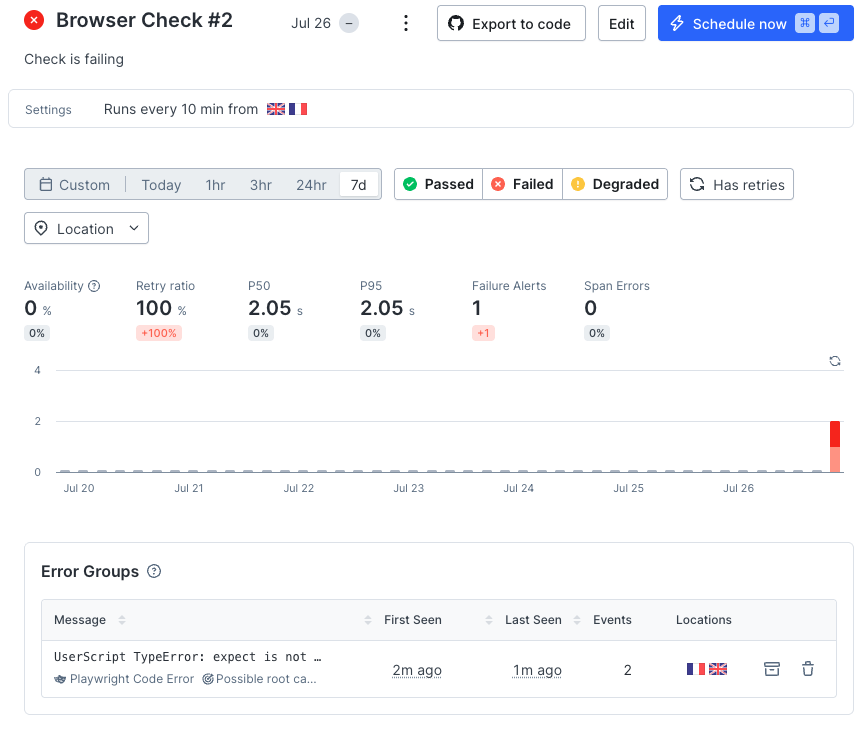
<p>Checkly is a developer-focused tool for continuous website testing and monitoring. You can run browser-based checks, monitor cron jobs, or run Playwright scripts.</p>
<p><img loading="lazy" src="https://www.debugbear.com/dimg/7cc63bdeef5bacac7cfdbbada0ad53f8.png" alt="Checkly detection options" style="border-radius:4px" data-abc="true" class="img_CujE"></p>
<p>You can configure alerts for failing checks and send notifications to your team. Set up public status pages to keep your customers informed as well.</p>
<p>Checkly has a free plan, with paid options starting from $9/mo.</p>
<p><img loading="lazy" src="https://www.debugbear.com/dimg/56b047b296c13a6f68e12edfbb82677b.png" alt="Checkly test result" style="border-radius:4px" data-abc="true" class="img_CujE"></p>
<h2 class="anchor anchorWithStickyNavbar_FNw8" id="8-uptrends">8. Uptrends<a href="https://www.debugbear.com/software/best-uptime-monitoring-tools#8-uptrends" class="hash-link" aria-label="Direct link to 8. Uptrends" title="Direct link to 8. Uptrends">​</a></h2>
<p>Uptrends by ITRS lets you keep track of website availability, run browser tests, and collect real user performance metrics.</p>
<p>The product provides broad monitoring support for scale-ups and enterprise customers. You can run tests from a large number of locations.</p>
<p><img loading="lazy" src="https://www.debugbear.com/dimg/d3595fdb764f924c1b647376434ef09b.png" alt="Uptrends monitor setup" style="border-radius:4px" data-abc="true" class="img_CujE"></p>
<p>Subscriptions start from $210 a month with a credit-based system.</p>
<h2 class="anchor anchorWithStickyNavbar_FNw8" id="9-datadog-synthetic-monitoring">9. Datadog Synthetic Monitoring<a href="https://www.debugbear.com/software/best-uptime-monitoring-tools#9-datadog-synthetic-monitoring" class="hash-link" aria-label="Direct link to 9. Datadog Synthetic Monitoring" title="Direct link to 9. Datadog Synthetic Monitoring">​</a></h2>
<p>Datadog is a comprehensive observability platform with self-service and enterprise options.</p>
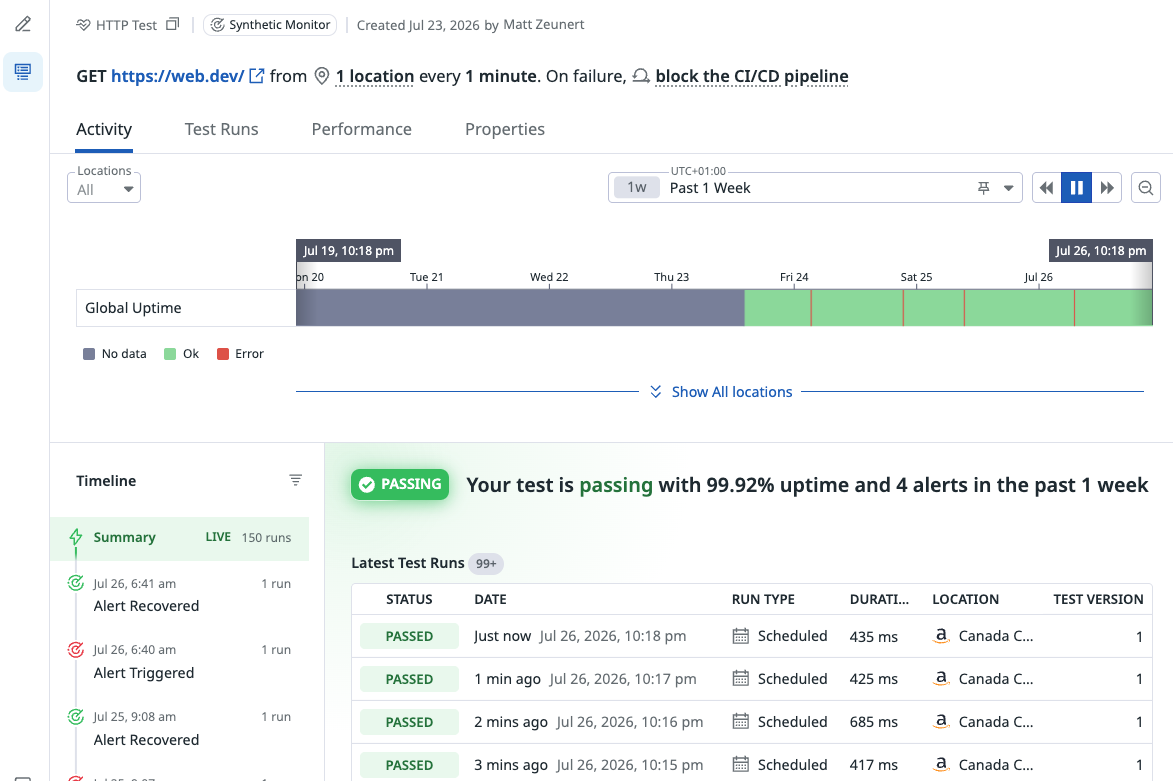
<p>As part of their digital experience monitoring features you can configure HTTP tests to continuously check the uptime of your website.</p>
<p><img loading="lazy" src="https://www.debugbear.com/dimg/57a6d255e16d84d1b3d205f11a7f9fed.png" alt="Datadog HTTP test" style="border-radius:4px" data-abc="true" class="img_CujE"></p>
<p>Pricing is based on the number of test runs. For example, 10 monitors with checks every minute would be about 446,400 test runs per month, and would cost around $223.</p>
<h2 class="anchor anchorWithStickyNavbar_FNw8" id="10-statusgator">10. StatusGator<a href="https://www.debugbear.com/software/best-uptime-monitoring-tools#10-statusgator" class="hash-link" aria-label="Direct link to 10. StatusGator" title="Direct link to 10. StatusGator">​</a></h2>
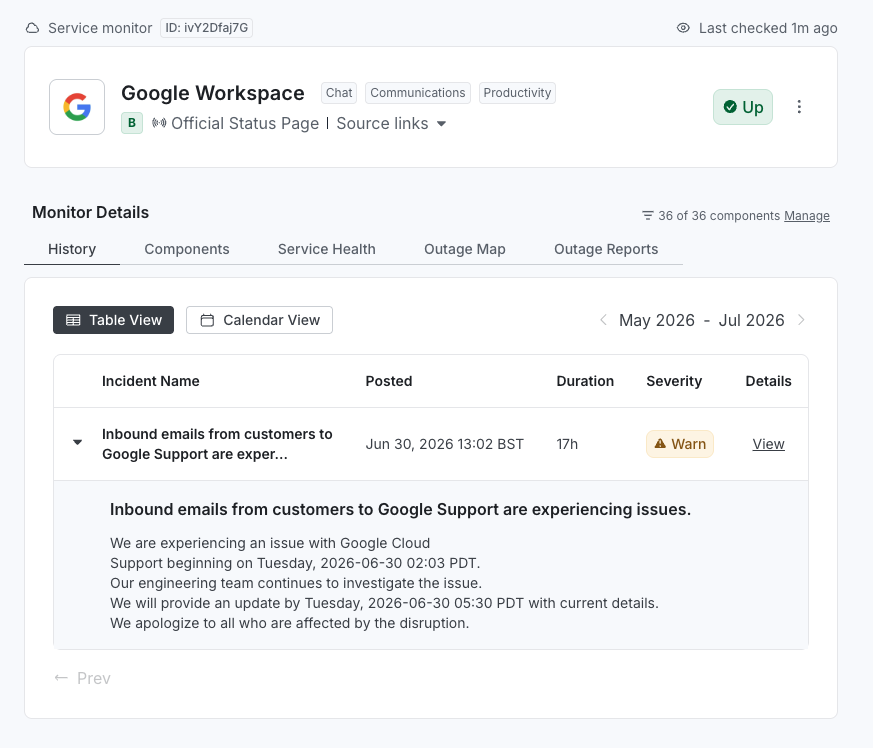
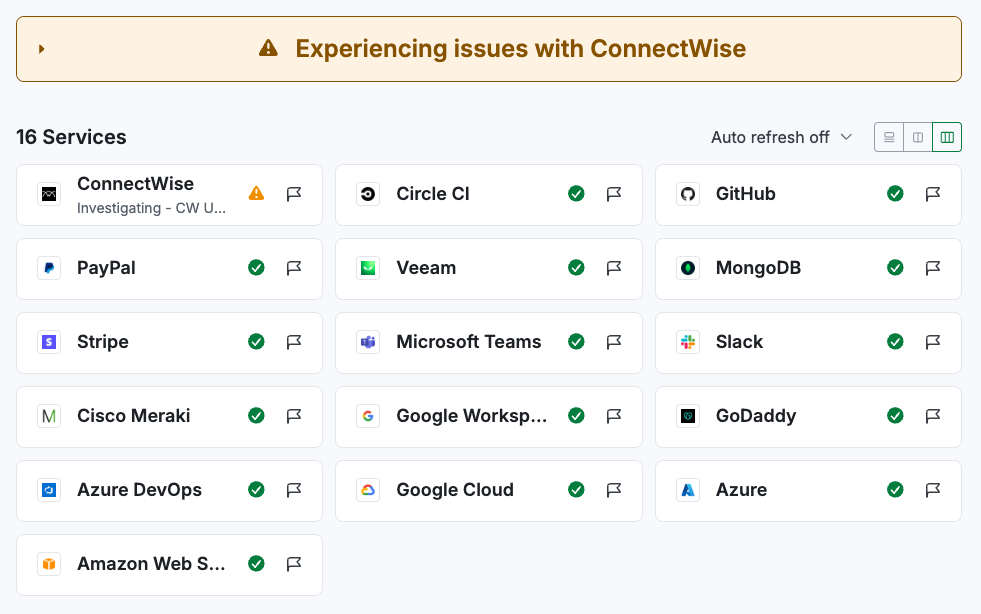
<p>StatusGator provides comprehensive availability coverage for your organization. Unlike other tools it doesn't just monitor your own website, but also keeps track of the services you rely on.</p>
<p>That way, when for example GitHub or AWS go down, your users know right away why some functionality or integrations might be unavailable.</p>
<p><img loading="lazy" src="https://www.debugbear.com/dimg/53defd1abd49d45c389d6675cf77de57.png" alt="Service selection" style="border-radius:4px" data-abc="true" class="img_CujE"></p>
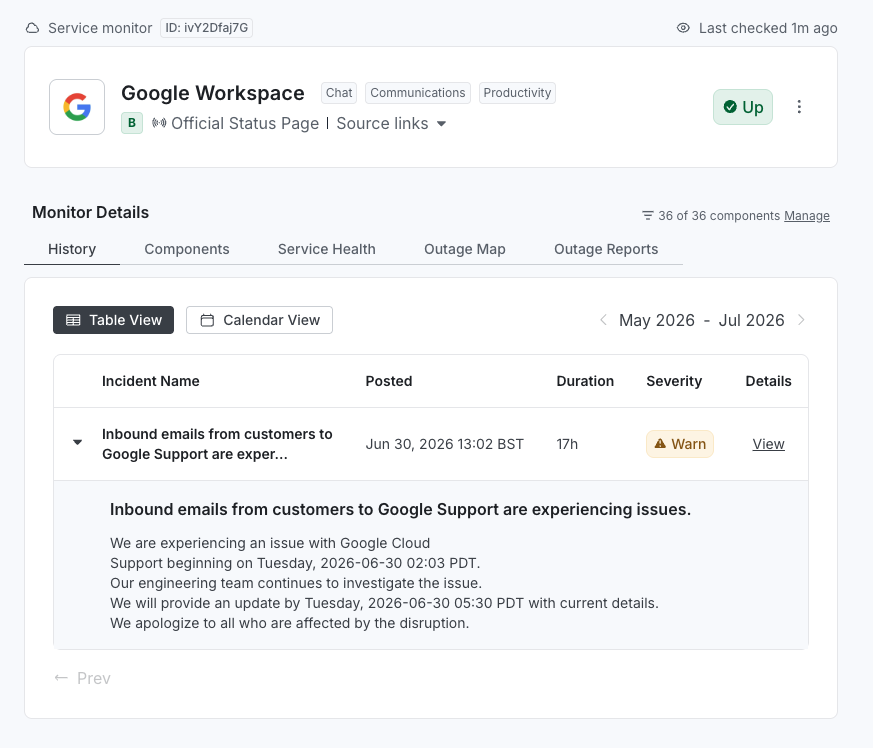
<p>You can then see any ongoing issues on your website or with a third-party provider at a glance.</p>
<p>StatusGator offers a free tier, with paid subscriptions starting from $72 per month.</p>
<p><img loading="lazy" src="https://www.debugbear.com/dimg/3589f45d40c9db980b150aa4b97a8c4e.png" alt="Google Workspace incident" style="border-radius:4px" data-abc="true" class="img_CujE"></p>
<h2 class="anchor anchorWithStickyNavbar_FNw8" id="11-oh-dear">11. Oh Dear<a href="https://www.debugbear.com/software/best-uptime-monitoring-tools#11-oh-dear" class="hash-link" aria-label="Direct link to 11. Oh Dear" title="Direct link to 11. Oh Dear">​</a></h2>
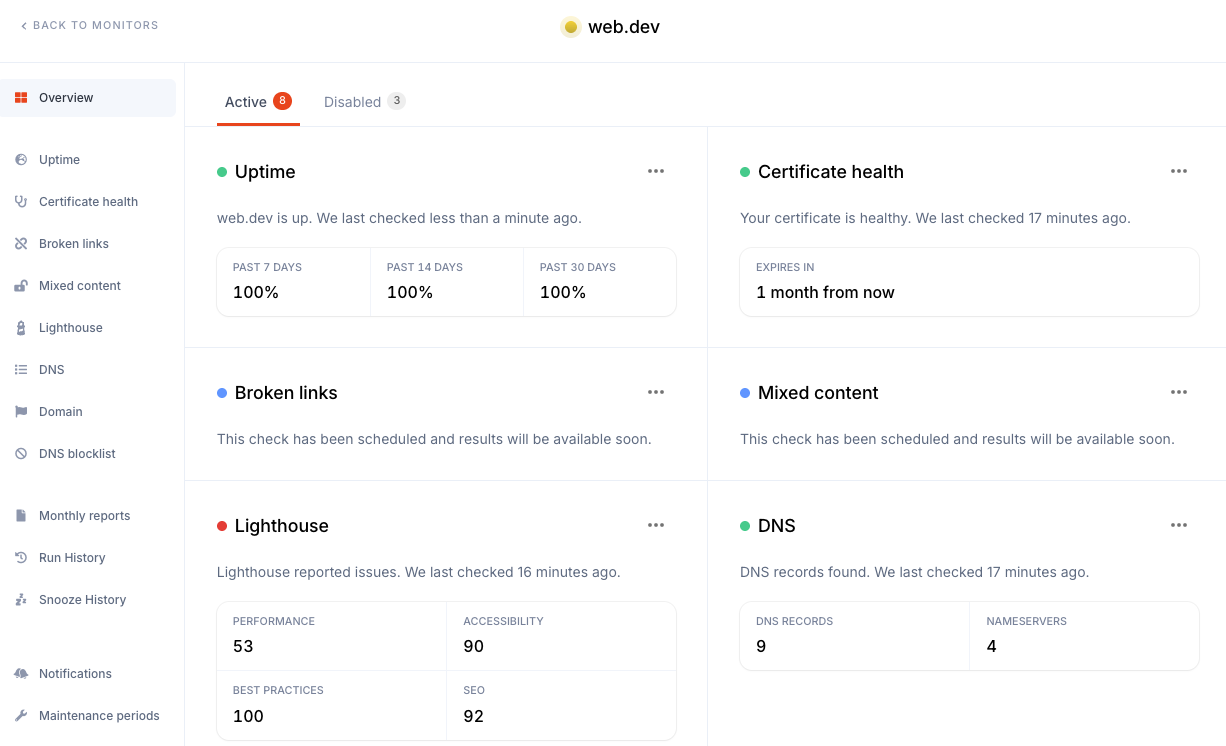
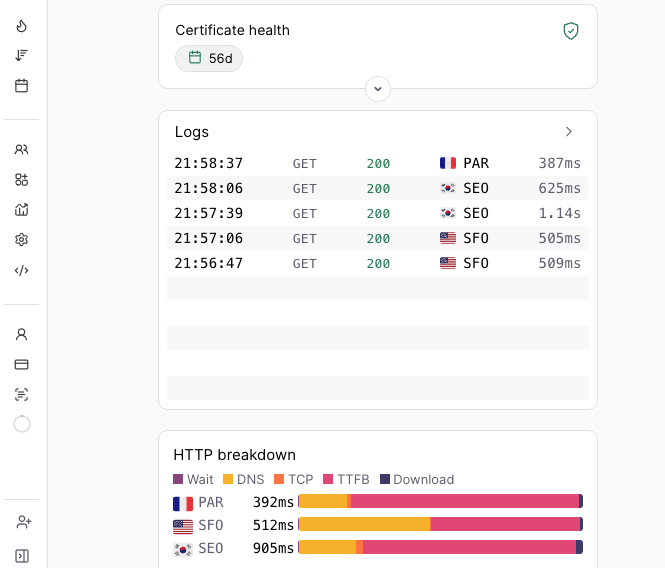
<p>Oh Dear is an all-in-one monitoring tool and each URL monitor runs many checks like website availability, Lighthouse scores, broken links, and certificate health. This makes it easy to set up monitoring for pages across your website.</p>
<p>The platform then provides detailed reports and historical data through a modern user interface.</p>
<p><img loading="lazy" src="https://www.debugbear.com/dimg/bcbbd223596221416d63c7cf3341e1bb.png" alt="Oh Dear website report" style="border-radius:4px" data-abc="true" class="img_CujE"></p>
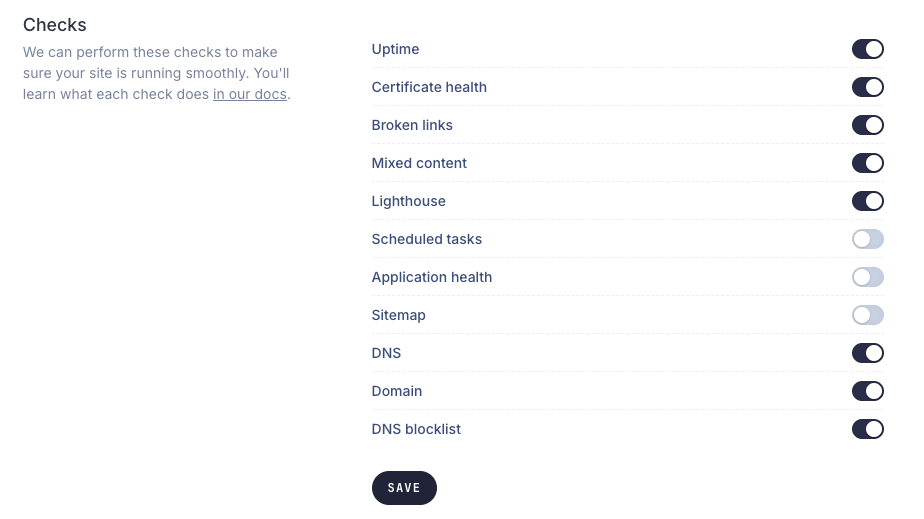
<p>While the initial setup is super easy, you can then customize settings like what type of checks are run, what test location to use, or how frequently to check your website availability.</p>
<p>The uptime checks also support additional settings like looking for a specific piece of text in the response.</p>
<p><img loading="lazy" src="https://www.debugbear.com/dimg/1f739b13e0ee45b82a2eb9164e9989da.png" alt="Types of checks in Oh Dear" style="border-radius:4px" data-abc="true" class="img_CujE"></p>
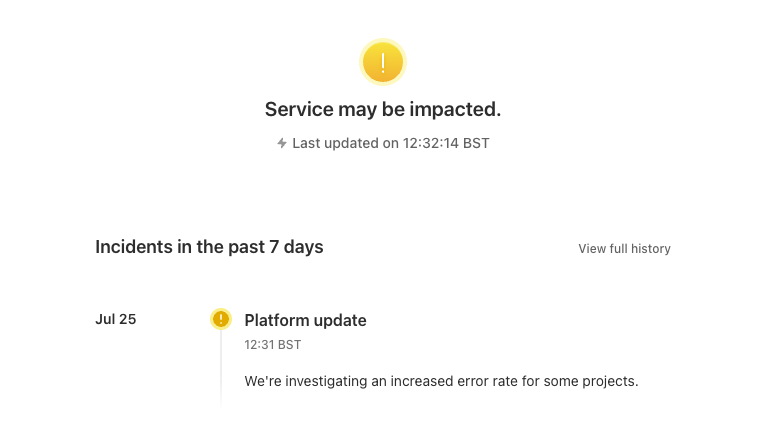
<p>You can also set up status pages based on the monitors you've set up. If you need to provide an update to your customers, just add a note to the status page and select a severity.</p>
<p><img loading="lazy" src="https://www.debugbear.com/dimg/e5abbaae8b1f12e3b401291583cc634a.png" alt="Oh Dear status page with custom notes" style="border-radius:4px" data-abc="true" class="img_CujE"></p>
<p>Oh Dear pricing starts from €15/mo for the Solo plan. To run 100 site checks you would need the Portfolio plan for €249/mo.</p>
<h2 class="anchor anchorWithStickyNavbar_FNw8" id="12-hyperping">12. Hyperping<a href="https://www.debugbear.com/software/best-uptime-monitoring-tools#12-hyperping" class="hash-link" aria-label="Direct link to 12. Hyperping" title="Direct link to 12. Hyperping">​</a></h2>
<p>Hyperping provides uptime monitoring, custom status pages, as well as extensive functionality for incident management and response.</p>
<p>You can validate server responses across different regions and keep track of response times.</p>
<p><img loading="lazy" src="https://www.debugbear.com/dimg/670428e90677e816818876aabc65c19f.png" alt="Hyperping status by region" style="border-radius:4px" data-abc="true" class="img_CujE"></p>
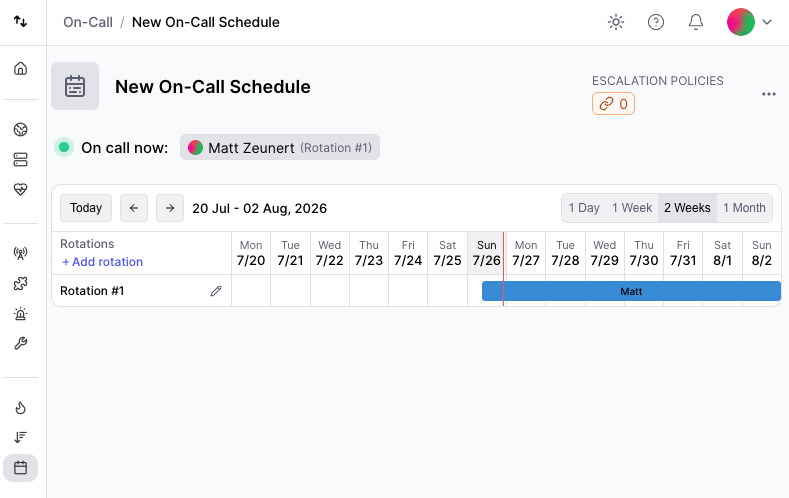
<p>Set up custom on-call schedules and rotas for your team, and define escalation policies to ensure issues get handled.</p>
<p>Hyperping offers a free plan with one seat, or you can subscribe for a paid subscription from $29/mo.</p>
<p><img loading="lazy" src="https://www.debugbear.com/dimg/476e814e4d6d8856d97578c67e6fcc2b.png" alt="Hyperping on-call schedule" style="border-radius:4px" data-abc="true" class="img_CujE"></p>
<h2 class="anchor anchorWithStickyNavbar_FNw8" id="13-pulsetic">13. Pulsetic<a href="https://www.debugbear.com/software/best-uptime-monitoring-tools#13-pulsetic" class="hash-link" aria-label="Direct link to 13. Pulsetic" title="Direct link to 13. Pulsetic">​</a></h2>
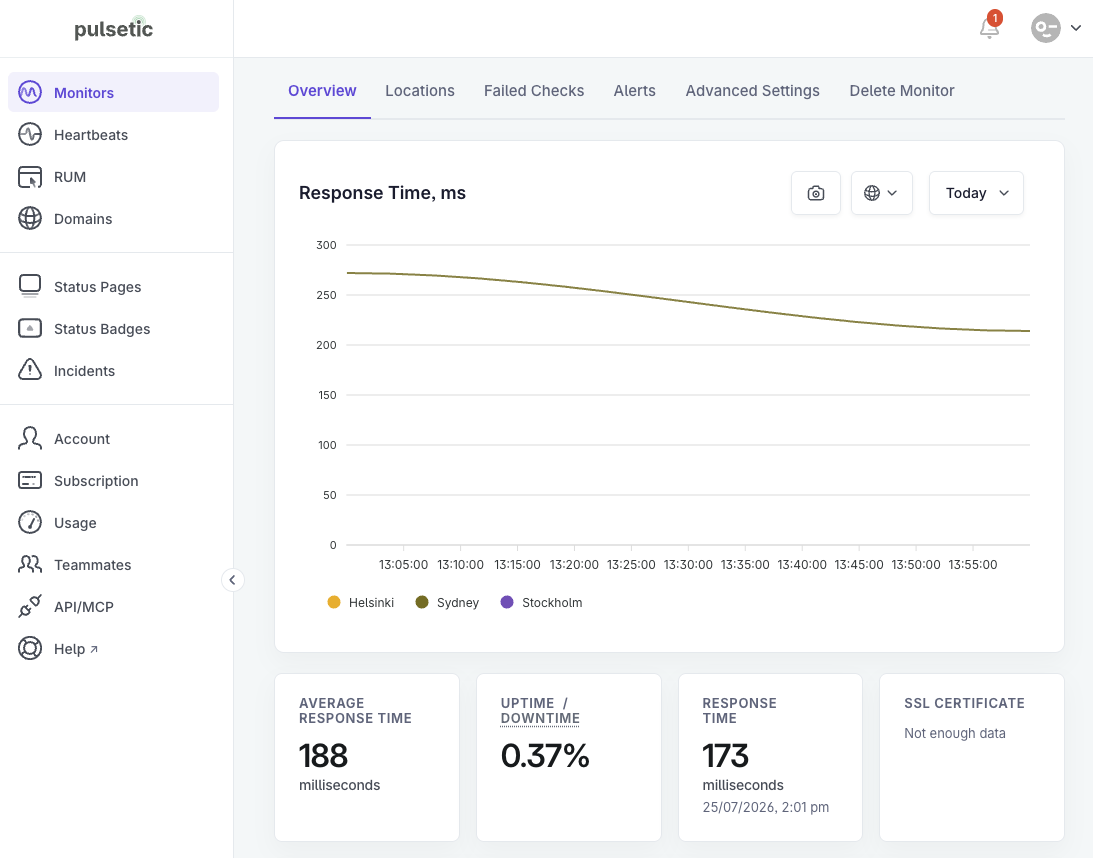
<p>Pulsetic offers website uptime monitoring, cron job heartbeat monitoring, as well as real user performance monitoring. You can also set up custom status pages to track incidents and keep your users informed.</p>
<p><img loading="lazy" src="https://www.debugbear.com/dimg/71699fc68eab5cb2449c01cf1787c5ec.png" alt="Status checks in Pulsetic" style="border-radius:4px" data-abc="true" class="img_CujE"></p>
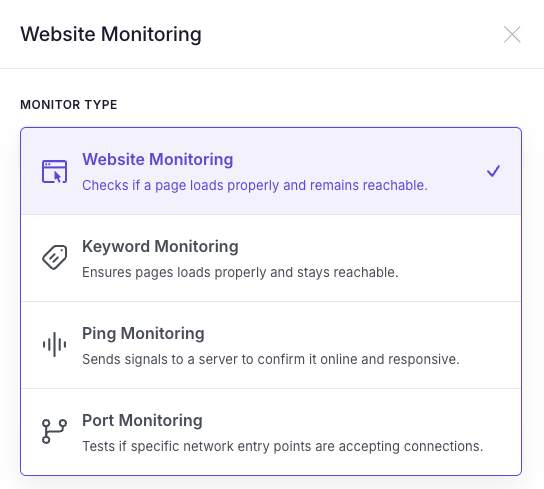
<p>You can run availability checks that validate HTTP response codes, look for specific page keywords, or monitor server pings and network ports.</p>
<p>Pulsetic offers a free plan with up to 10 monitors that run every 5 minutes. Paid plans start at $9/mo.</p>
<p><img loading="lazy" src="https://www.debugbear.com/dimg/971ab93ade9eaa689566b0efbd5e068f.png" alt="Pulsetic monitoring types" style="border-radius:4px" data-abc="true" class="img_CujE"></p>
<h2 class="anchor anchorWithStickyNavbar_FNw8" id="how-to-choose-an-uptime-monitoring-tool">How to choose an uptime monitoring tool<a href="https://www.debugbear.com/software/best-uptime-monitoring-tools#how-to-choose-an-uptime-monitoring-tool" class="hash-link" aria-label="Direct link to How to choose an uptime monitoring tool" title="Direct link to How to choose an uptime monitoring tool">​</a></h2>
<p>What tool is best for you depends on your team's needs:</p>
<ul>
<li>How many monitors do you need and at what frequency? This will impact pricing across different options.</li>
<li>Are you looking for a tool focused on availability monitoring, or do you want to monitor page speed or backend performance as well?</li>
<li>Does your team need integrations with specific services?</li>
<li>Do you need to set up a customer-facing status page?</li>
<li>Does your website require a response from your team within minutes or are outages not business critical?</li>
</ul>
<p>Most of the tools in this list offer a free plan or trial, so the best way to find the right fit is to set up a few monitors and see how each service works in practice.</p>]]></content>
        <author>
            <name>Matt Zeunert</name>
        </author>
    </entry>
    <entry>
        <title type="html"><![CDATA[Best Digital Experience Monitoring Solutions: A 2026 Guide]]></title>
        <id>https://www.debugbear.com/software/digital-experience-monitoring-tools</id>
        <link href="https://www.debugbear.com/software/digital-experience-monitoring-tools"/>
        <updated>2026-05-12T00:00:00.000Z</updated>
        <summary type="html"><![CDATA[A comparison of the best Digital Experience Monitoring (DEM) tools in 2026, covering real user monitoring, synthetic testing, and full-stack observability features.]]></summary>
        <content type="html"><![CDATA[<p><a href="https://www.debugbear.com/software/digital-experience-monitoring">Digital Experience Monitoring</a> helps you track and improve user experience. Based on this data, product, marketing, and engineering teams can deliver fast and reliable websites.</p>
<p>This guide compares the different DEM solutions and highlights when they might be the best fit.</p>
<h2 class="anchor anchorWithStickyNavbar_FNw8" id="what-is-digital-experience-monitoring">What is Digital Experience Monitoring?<a href="https://www.debugbear.com/software/digital-experience-monitoring-tools#what-is-digital-experience-monitoring" class="hash-link" aria-label="Direct link to What is Digital Experience Monitoring?" title="Direct link to What is Digital Experience Monitoring?">​</a></h2>
<p>Digital Experience Monitoring combines different data sources to provide a comprehensive view of user experience:</p>
<ul>
<li><a href="https://www.debugbear.com/docs/what-is-real-user-monitoring"><strong>Real User Monitoring (RUM)</strong></a> measures performance, conversion rates, errors, and more for actual visitors</li>
<li><a href="https://www.debugbear.com/docs/synthetic-website-monitoring"><strong>Synthetic monitoring</strong></a> runs scheduled tests in a controlled test environment (both for the initial page load and scripted user journeys)</li>
<li><strong>Uptime monitoring</strong> checks that your website is available and responsive</li>
<li><strong>Backend monitoring</strong> provides detailed insight into slow application server and database processing</li>
</ul>
<p>Some DEM tools include all of these features, while others focus on specific aspects of digital experience. Monitoring tools both measure what the user experience is like and provide technical insights on how to resolve any issues.</p>
<h2 class="anchor anchorWithStickyNavbar_FNw8" id="debugbear">DebugBear<a href="https://www.debugbear.com/software/digital-experience-monitoring-tools#debugbear" class="hash-link" aria-label="Direct link to DebugBear" title="Direct link to DebugBear">​</a></h2>
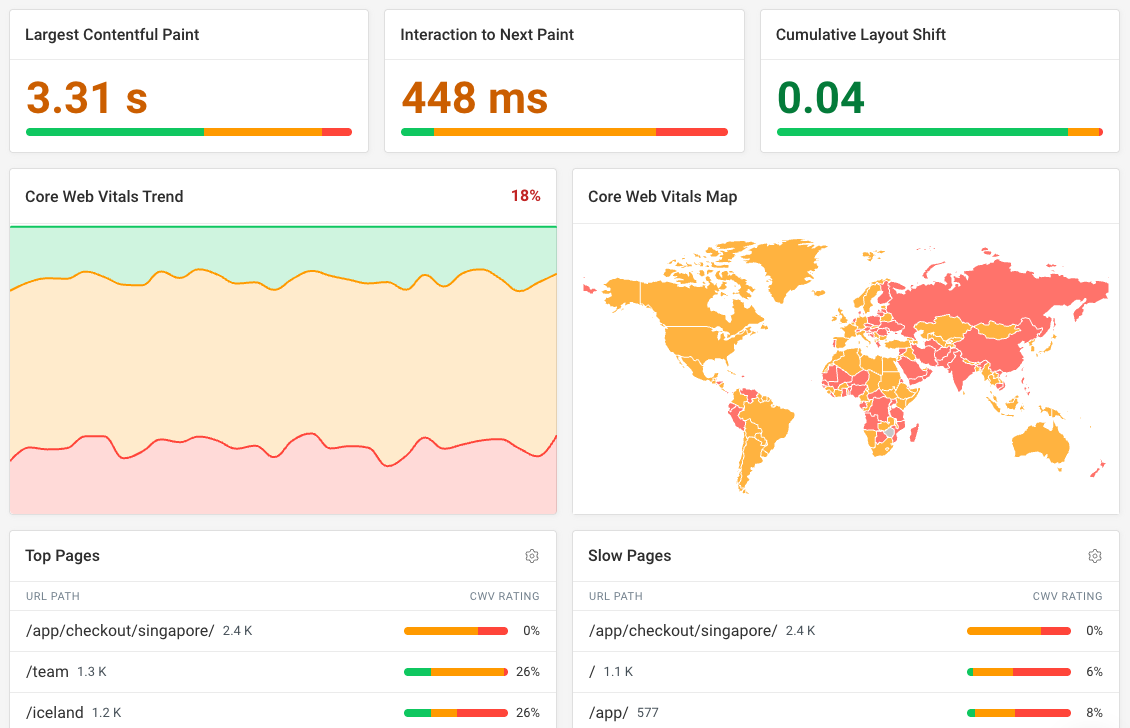
<p><a href="https://www.debugbear.com/">DebugBear</a> provides in-depth web performance and visitor experience data based on real user analytics and synthetic testing. In particular, it focuses on Google's <a href="https://www.debugbear.com/docs/metrics/core-web-vitals">Core Web Vitals</a> metrics and overall frontend performance.</p>
<p>You can set up alerts for key metrics and get detailed technical insights to optimize performance and diagnose the cause of regressions.</p>
<p><img loading="lazy" src="https://www.debugbear.com/dimg/2ef31c7159f3b3b2079819cf1d99e055.png" alt="DebugBear RUM screenshot" style="border-radius:4px" data-abc="true" class="img_CujE"></p>
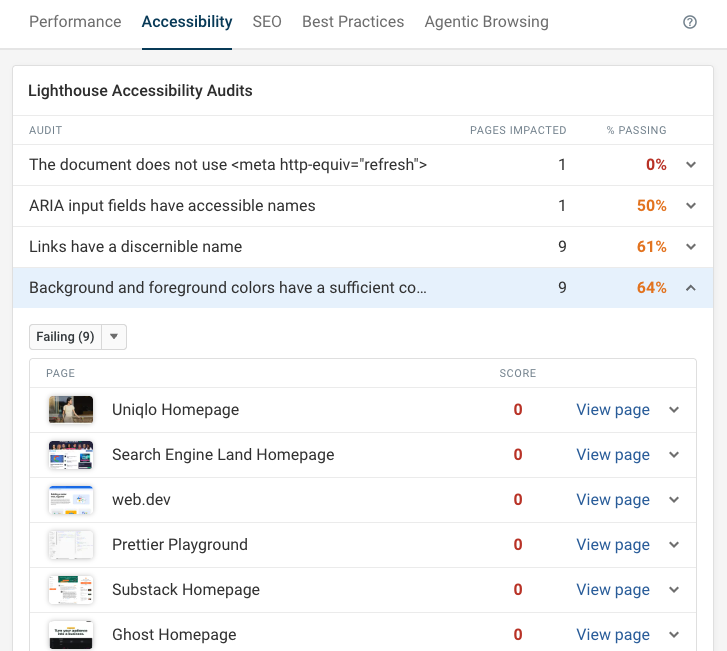
<p>You can also track Lighthouse scores for accessibility, SEO, best practices, and <a href="https://www.debugbear.com/blog/lighthouse-agentic-browsing">agentic browsing</a>. This helps you improve the overall quality of your website beyond just performance.</p>
<p>This site-wide view lets you identify the most common issues across your website and prioritize those optimizations.</p>
<p><img loading="lazy" src="https://www.debugbear.com/dimg/b698bbc5b55a42386f6069bd087884da.png" alt="Lighthouse audits view" style="border-radius:4px" data-abc="true" class="img_CujE"></p>
<p>DebugBear is a web performance tool focused on end user experience, including uptime monitoring. It does not include support for server-side performance measurements.</p>
<h2 class="anchor anchorWithStickyNavbar_FNw8" id="contentsquare">Contentsquare<a href="https://www.debugbear.com/software/digital-experience-monitoring-tools#contentsquare" class="hash-link" aria-label="Direct link to Contentsquare" title="Direct link to Contentsquare">​</a></h2>
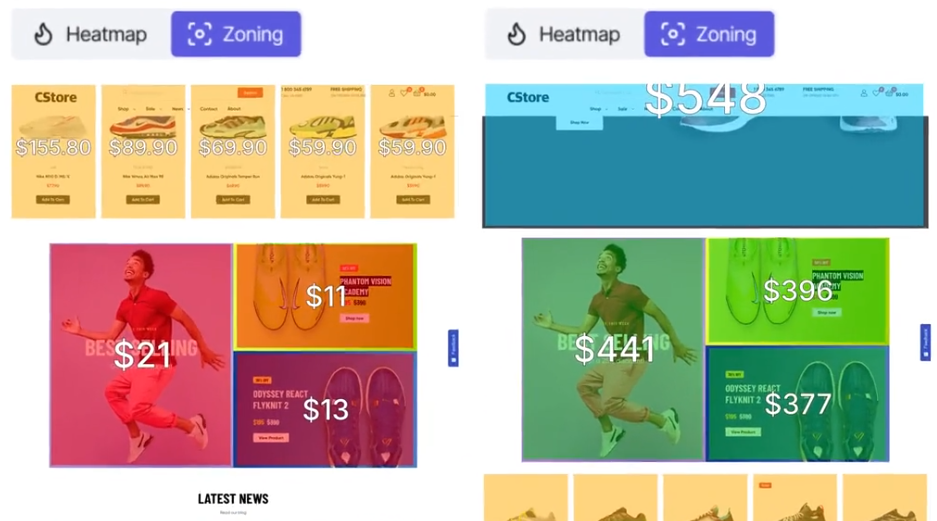
<p>Contentsquare is a digital experience platform with a focus on product analytics and user behavior. It aims to tie experience data closely to business outcomes to help improve conversion rates.</p>
<p>The product offers heatmap recordings, session replay, as well as real user and synthetic performance monitoring.</p>
<p><img loading="lazy" src="https://www.debugbear.com/dimg/6d4e13854b21995d44dc086d81e8386b.png" alt="ContentSquare reporting" style="border-radius:4px" data-abc="true" class="img_CujE"></p>
<p>Contentsquare is a business-focused tool that tries to connect user experience with revenue generation. However, it has less of a technical focus compared to more advanced web performance tools.</p>
<h2 class="anchor anchorWithStickyNavbar_FNw8" id="dynatrace">Dynatrace<a href="https://www.debugbear.com/software/digital-experience-monitoring-tools#dynatrace" class="hash-link" aria-label="Direct link to Dynatrace" title="Direct link to Dynatrace">​</a></h2>
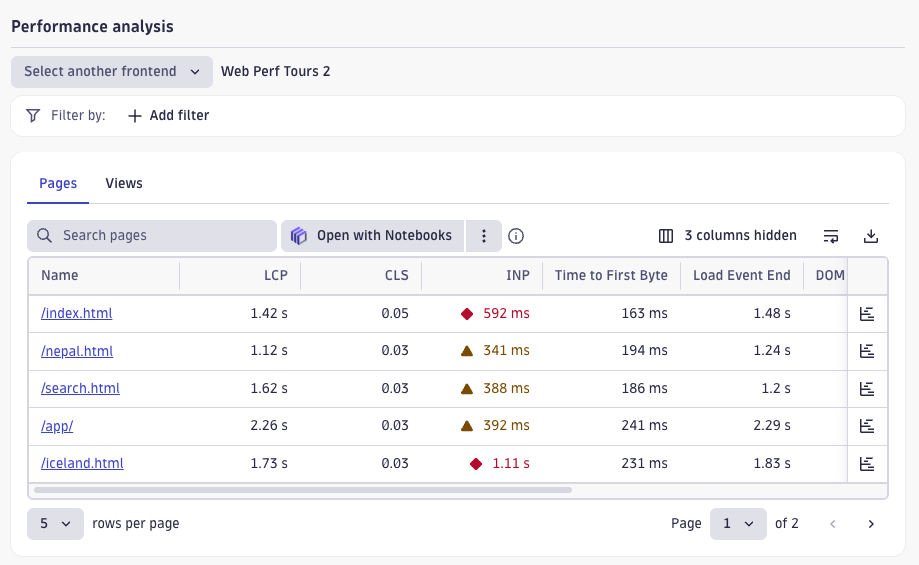
<p>Dynatrace is a comprehensive observability platform that covers synthetic tests, real user monitoring, backend application monitoring and more.</p>
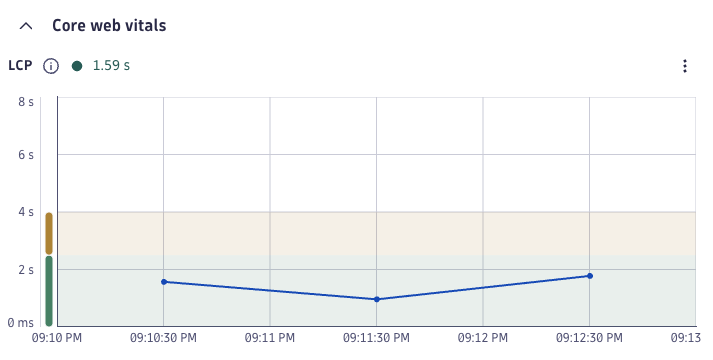
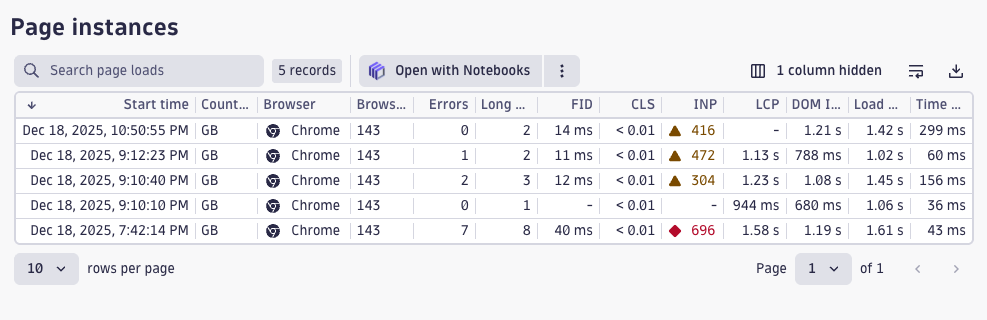
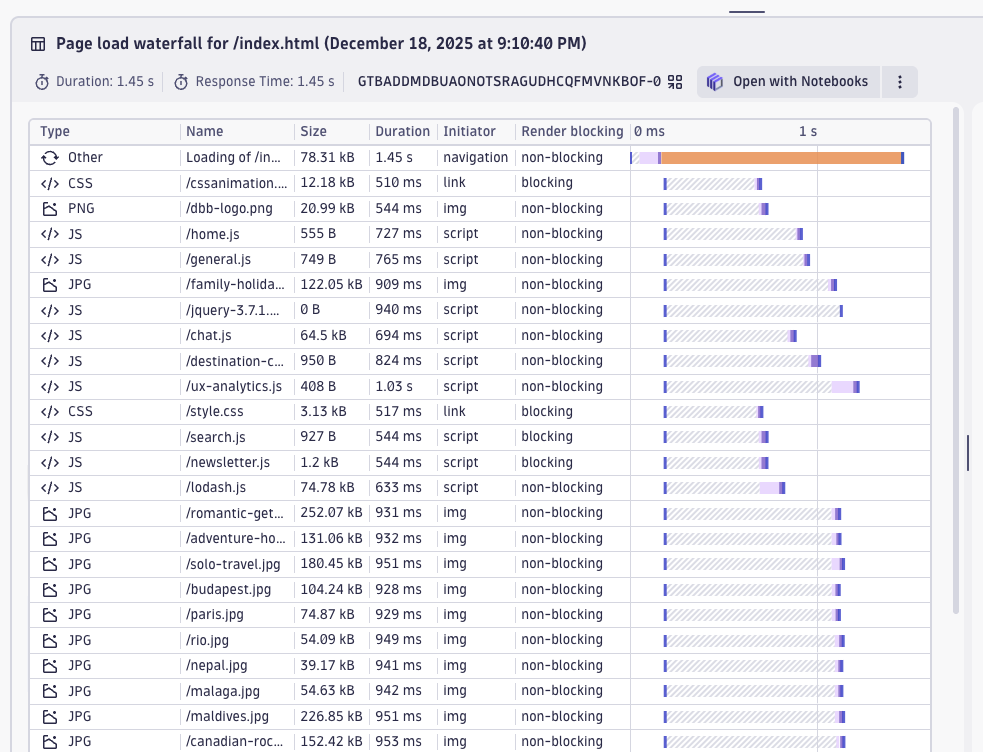
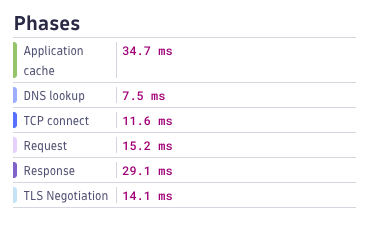
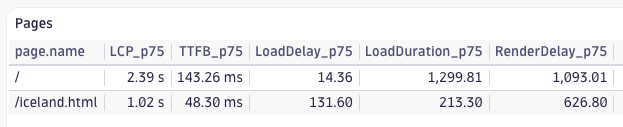
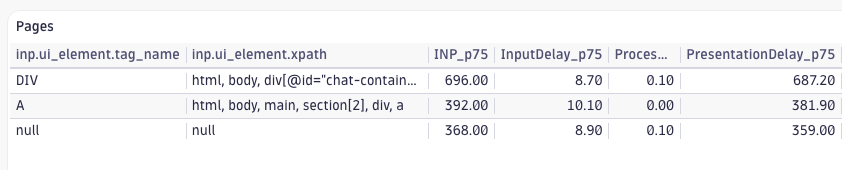
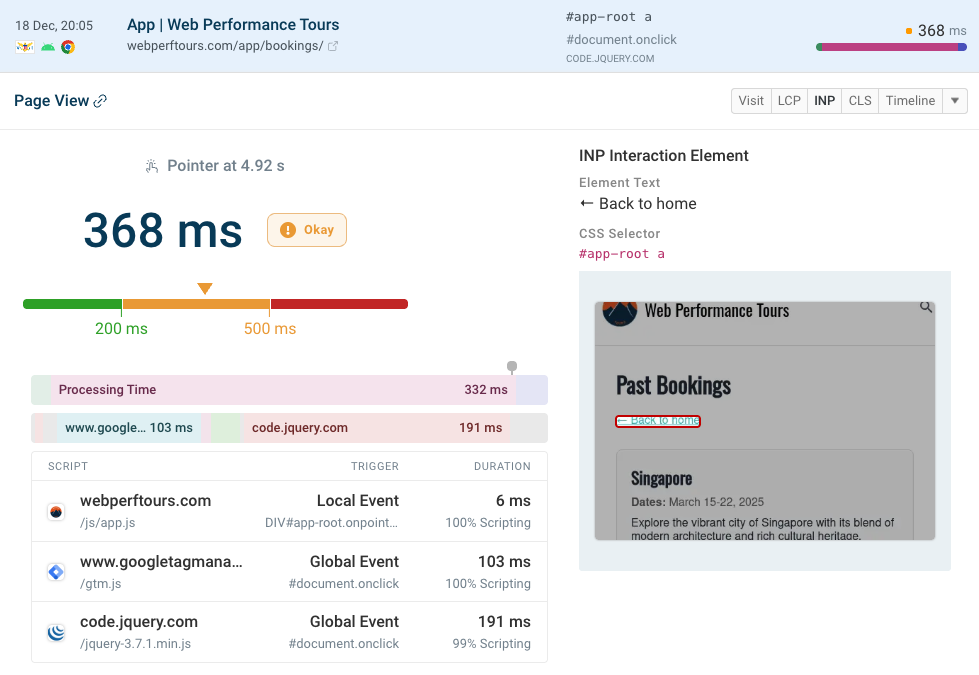
<p>You can record detailed data relevant to visitor experience and performance on your website. Dynatrace Query Language (DQL) allows you to set up in-depth custom dashboards based on the data you've recorded.</p>
<p><img loading="lazy" src="https://www.debugbear.com/dimg/2f1f7642705e9e44e0fe05de8c02a093.png" alt="Dynatrace web performance data" style="border-radius:4px" data-abc="true" class="img_CujE"></p>
<p>Dynatrace is a powerful tool that offers a lot of flexibility for teams to set up their own data pipeline. While the product provides pre-built dashboards, it does not force you down one particular path to analyze your data.</p>
<h2 class="anchor anchorWithStickyNavbar_FNw8" id="new-relic">New Relic<a href="https://www.debugbear.com/software/digital-experience-monitoring-tools#new-relic" class="hash-link" aria-label="Direct link to New Relic" title="Direct link to New Relic">​</a></h2>
<p>Like Dynatrace, New Relic is a comprehensive tool that provides detailed insights across a wide range of monitoring needs.</p>
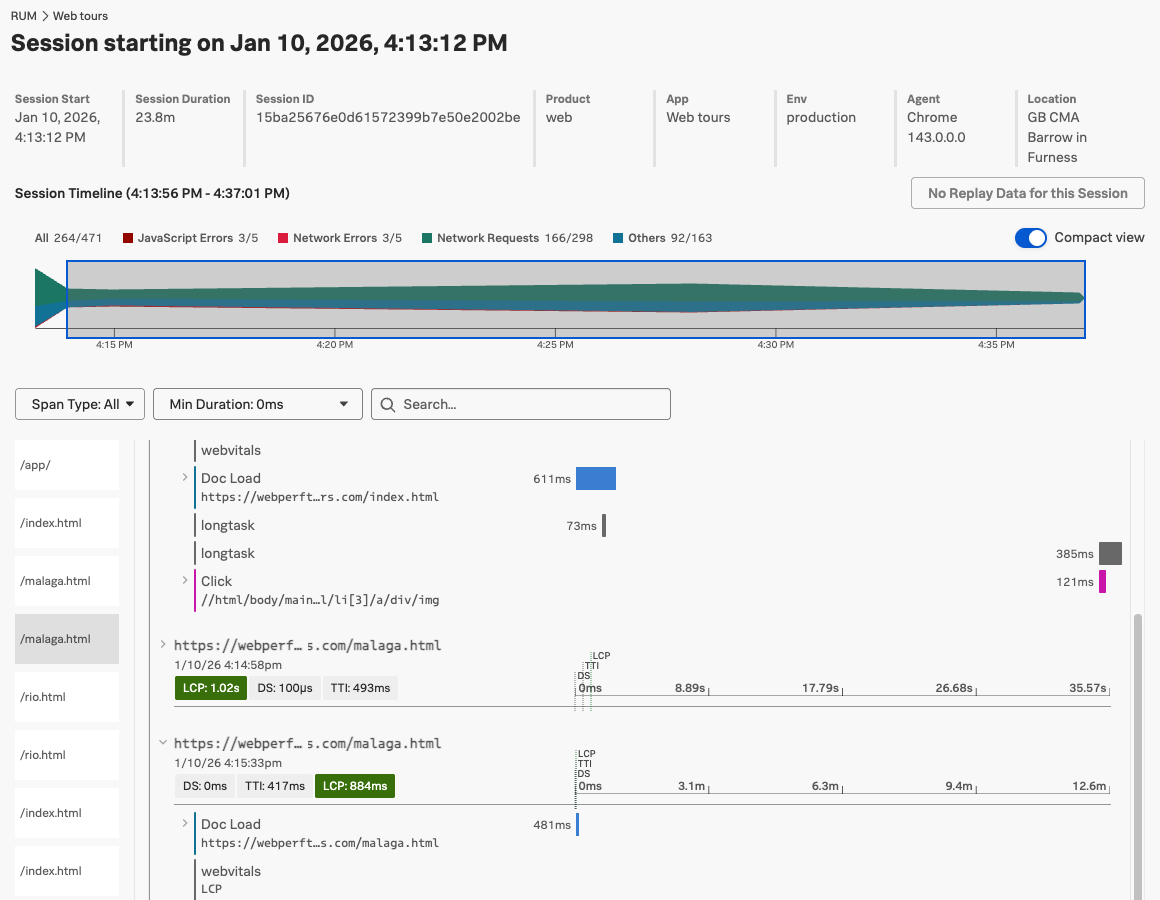
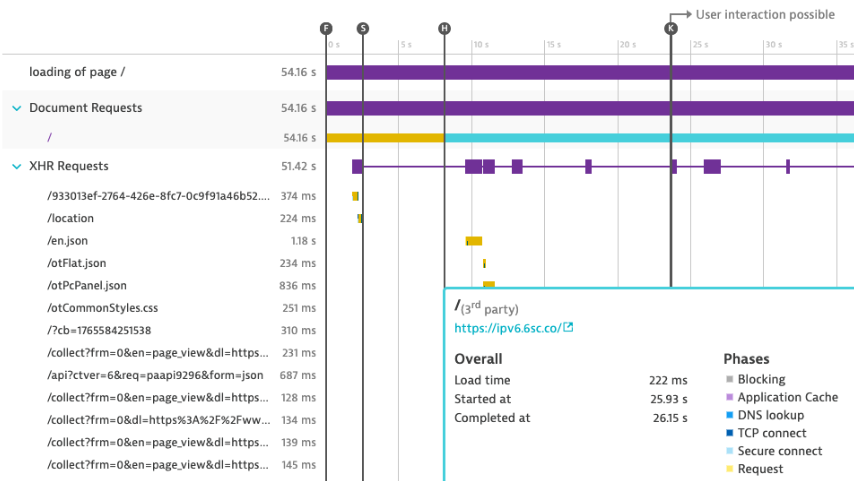
<p>Its real user monitoring feature can track in-depth data on visitor sessions. For example, you can see what requests were made, how visitors interacted with the page, and when long CPU tasks slowed down the page.</p>
<p><img loading="lazy" src="https://www.debugbear.com/dimg/6828215780b5aa4cb92bc3e6aa758ac2.png" alt="New Relic web performance analysis" style="border-radius:4px" data-abc="true" class="img_CujE"></p>
<h2 class="anchor anchorWithStickyNavbar_FNw8" id="pingdom">Pingdom<a href="https://www.debugbear.com/software/digital-experience-monitoring-tools#pingdom" class="hash-link" aria-label="Direct link to Pingdom" title="Direct link to Pingdom">​</a></h2>
<p>Pingdom covers a wide range of website monitoring needs, including uptime monitoring, real user monitoring, and synthetic testing. However, it is more small-business friendly compared to the larger enterprise tools like Dynatrace and New Relic.</p>
<p>While Pingdom provides real user insights and synthetic data, this functionality is more limited compared to more specialized tools.</p>
<p><img loading="lazy" src="https://www.debugbear.com/dimg/73a5c7ccaae1da13c469173fa3e44937.png" alt="Pingdom real user monitoring data" style="border-radius:4px" data-abc="true" class="img_CujE"></p>
<h2 class="anchor anchorWithStickyNavbar_FNw8" id="sentry">Sentry<a href="https://www.debugbear.com/software/digital-experience-monitoring-tools#sentry" class="hash-link" aria-label="Direct link to Sentry" title="Direct link to Sentry">​</a></h2>
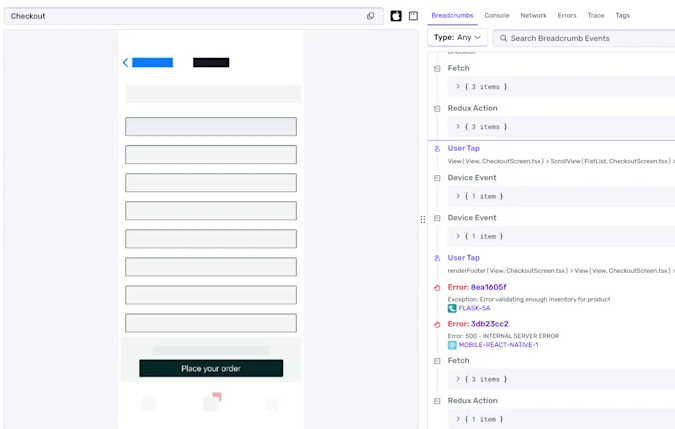
<p>Sentry is an error and performance monitoring service for developers. It offers detailed performance traces to help you identify and fix bottlenecks in your code.</p>
<p>You can also replay sessions to see how users interacted with your website and what their experience was like.</p>
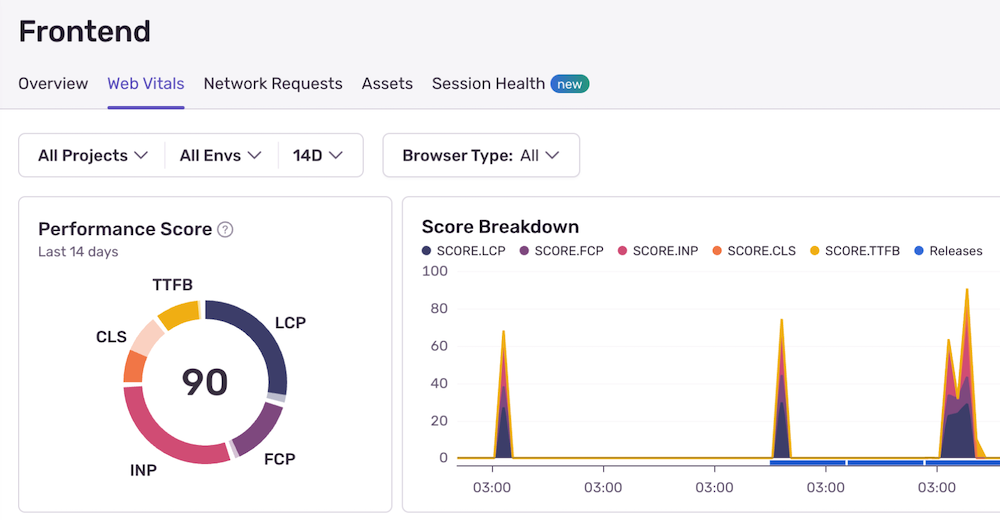
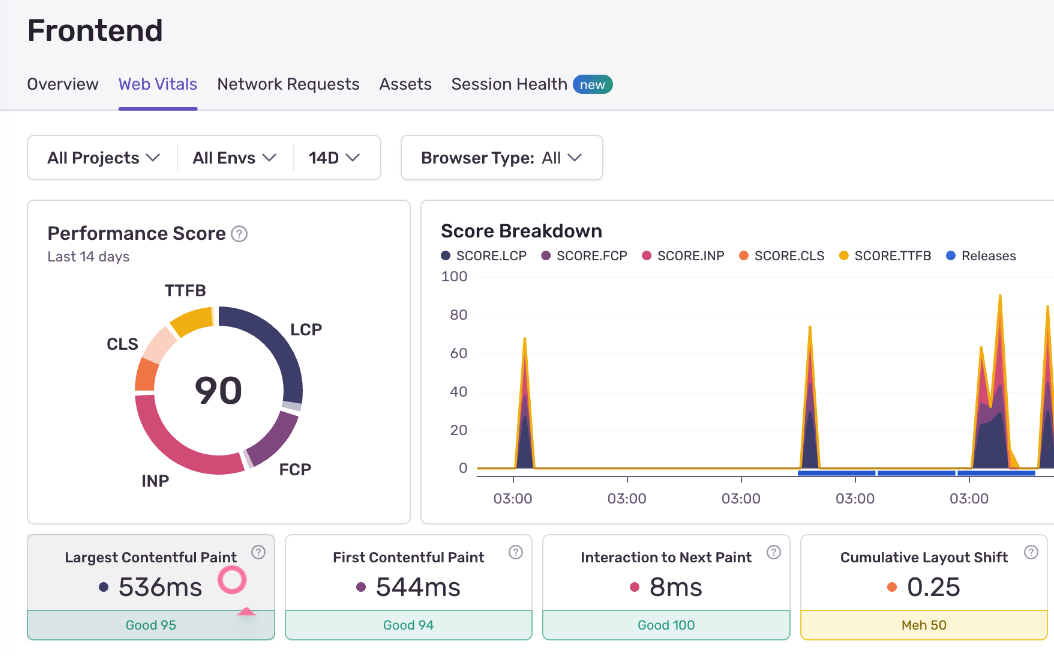
<p><img loading="lazy" src="https://www.debugbear.com/dimg/9a62a8b3ad7b54dde5da5958a85ff653.png" alt="Sentry performance data" style="border-radius:4px" data-abc="true" class="img_CujE"></p>
<p>Sentry covers not just end user experience in the browser, but also mobile and backend performance. This makes it a good fit for teams who want full visibility into the technical issues that slow down their product.</p>
<h2 class="anchor anchorWithStickyNavbar_FNw8" id="what-to-look-for-in-a-dem-tool">What to look for in a DEM tool<a href="https://www.debugbear.com/software/digital-experience-monitoring-tools#what-to-look-for-in-a-dem-tool" class="hash-link" aria-label="Direct link to What to look for in a DEM tool" title="Direct link to What to look for in a DEM tool">​</a></h2>
<p>The right DEM tool for you depends on what data your team needs, who's using the tool, and what other tools you have already:</p>
<ul>
<li>Do you need to tie business metrics and user experience together?</li>
<li>Does your development team need more detailed technical reporting?</li>
<li>Are you monitoring a complex application or a simple marketing website?</li>
</ul>
<p>Digital experience tools tie different <a href="https://www.debugbear.com/blog/types-of-monitoring">types of website monitoring data</a> together. If you're focused on Core Web Vitals and frontend performance, DebugBear is a great fit. For full-stack observability, bigger tools like Dynatrace and New Relic make more sense.</p>
<p>When picking a tool:</p>
<ul>
<li>Check what data sources it supports</li>
<li>Check how you can configure alerting and custom dashboards</li>
<li>Check what integrations it has with your existing workflow (CI, Slack, etc.)</li>
<li>Check how the pricing scales with your traffic and usage</li>
</ul>
<!-- -->
<div class="cta_Vy7l"><div class="ctaContainer_dzq8"><div class="ctaImage_MZ5b"><img src="https://www.debugbear.com/dimg/57001785e35454b95f43aa4f3bf6f857.png" alt="Illustration of website monitoring" class="themedComponent_mlkZ themedComponent--light_NVdE"><img src="https://www.debugbear.com/dimg/b2c0ae7a8dfbc4b18ba827a334c5c1af.png" alt="Illustration of website monitoring" class="themedComponent_mlkZ themedComponent--dark_xIcU"></div><div class="ctaContent_VgWi"><h2>Monitor Page Speed &amp; Core Web Vitals</h2><div class="ctaBenefits_OYw7"><h3>DebugBear monitoring includes:</h3><ul><li>In-depth Page Speed Reports</li><li>Automated Recommendations</li><li>Real User Analytics Data</li></ul></div><div><a href="https://www.debugbear.com/signup" class="ctaButton_Uos9 hidden-when-logged-in"><span>Start Free Trial</span></a><a href="https://www.debugbear.com/app" class="ctaButton_Uos9 visible-when-logged-in"><span>Go To App</span></a></div></div></div></div>]]></content>
        <author>
            <name>Matt Zeunert</name>
        </author>
    </entry>
    <entry>
        <title type="html"><![CDATA[The 9 Best Synthetic Monitoring Tools Reviewed For 2026]]></title>
        <id>https://www.debugbear.com/software/best-synthetic-monitoring-tools</id>
        <link href="https://www.debugbear.com/software/best-synthetic-monitoring-tools"/>
        <updated>2026-01-27T00:00:00.000Z</updated>
        <summary type="html"><![CDATA[Compare the best synthetic monitoring tools for website performance testing. We review 9 tools to help you choose the right one for your needs.]]></summary>
        <content type="html"><![CDATA[<p>Web performance monitoring is key for maintaining a fast, reliable website. <a href="https://www.debugbear.com/blog/synthetic-vs-rum">Synthetic monitoring</a> tools help you track your website's performance by simulating user interactions and measuring key metrics.</p>
<p>This guide compares a number of synthetic monitoring solutions. We evaluate their key features, pricing, and limitations to help you choose the right tool for your needs.</p>
<h2 class="anchor anchorWithStickyNavbar_FNw8" id="what-are-synthetic-monitoring-tools">What are synthetic monitoring tools?<a href="https://www.debugbear.com/software/best-synthetic-monitoring-tools#what-are-synthetic-monitoring-tools" class="hash-link" aria-label="Direct link to What are synthetic monitoring tools?" title="Direct link to What are synthetic monitoring tools?">​</a></h2>
<p>Synthetic monitoring tools continuously check your website performance to tell you how fast it is, alert you to regressions, and produce reports that you can use to optimize your page speed.</p>
<p>They are also referred to as lab-based tests, because they are run in a lab environment under controlled testing conditions. That stands in contrast to <a href="https://www.debugbear.com/software/best-real-user-monitoring-tools">real user monitoring tools</a>, which collect data on actual visitors.</p>
<p>Synthetic tools provide more in-depth reporting and can run tests on demand. Real user monitoring describes the actual visitor experience, but offers more limited reporting and only works for production websites that get regular traffic.</p>
<h2 class="anchor anchorWithStickyNavbar_FNw8" id="why-do-you-need-a-synthetic-monitoring-tool">Why do you need a synthetic monitoring tool?<a href="https://www.debugbear.com/software/best-synthetic-monitoring-tools#why-do-you-need-a-synthetic-monitoring-tool" class="hash-link" aria-label="Direct link to Why do you need a synthetic monitoring tool?" title="Direct link to Why do you need a synthetic monitoring tool?">​</a></h2>
<p>Synthetic website monitoring tools help you keep track of your website performance over time and deliver a great visitor experience and pass Google's <a href="https://www.debugbear.com/docs/metrics/core-web-vitals">Core Web Vitals</a> assessment. They allow you to continuously test your website speed in order to identify potential optimizations and get alerted when there's a page speed issue.</p>
<p>While a comprehensive optimization strategy requires <a href="https://www.debugbear.com/blog/types-of-monitoring">multiple types of monitoring</a>, synthetic monitoring in particular has the following key strengths:</p>
<ul>
<li>Synthetic data is the most detailed type of data available, and comes with tailored performance recommendations</li>
<li>Data is collected in a controlled lab environment, and is not liable to fluctuations due to changing visitor patterns</li>
<li>Any website can support synthetic monitoring, even if the website doesn't have enough traffic (such as a staging website)</li>
</ul>
<h2 class="anchor anchorWithStickyNavbar_FNw8" id="1-debugbear">1. DebugBear<a href="https://www.debugbear.com/software/best-synthetic-monitoring-tools#1-debugbear" class="hash-link" aria-label="Direct link to 1. DebugBear" title="Direct link to 1. DebugBear">​</a></h2>
<p><a href="https://debugbear.com/" target="_blank" rel="noopener noreferrer">DebugBear</a> is a web performance monitoring service that tracks <a href="https://www.debugbear.com/docs/metrics/core-web-vitals">Core Web Vitals</a>, site speed metrics, and user experience data to help optimize website performance and SEO rankings.</p>
<p>Here's an overview dashboard from DebugBear, showing page speed for different monitored pages at a glance.</p>
<p><img loading="lazy" src="https://www.debugbear.com/dimg/c4245149058434616939f32615f8b2f2.png" alt="DebugBear dashboard" style="border-radius:4px" data-abc="true" class="img_CujE"></p>
<h3 class="anchor anchorWithStickyNavbar_FNw8" id="key-features">Key Features<a href="https://www.debugbear.com/software/best-synthetic-monitoring-tools#key-features" class="hash-link" aria-label="Direct link to Key Features" title="Direct link to Key Features">​</a></h3>
<ul>
<li>Lab-based automated testing with Lighthouse scores</li>
<li>Visual regression tracking with filmstrip and <a href="https://www.debugbear.com/docs/waterfall">waterfall views</a></li>
<li><a href="https://www.debugbear.com/google-crux-monitoring">Chrome User Experience Report (CrUX)</a> data integration</li>
<li>Automatic alerts for performance regressions</li>
<li>Network <a href="https://www.debugbear.com/docs/request-initiator-chain">request chain analysis</a> for debugging</li>
<li>Also offers <a href="https://www.debugbear.com/software/best-real-user-monitoring-tools">real user monitoring</a> across entire websites</li>
</ul>
<h3 class="anchor anchorWithStickyNavbar_FNw8" id="pros">Pros<a href="https://www.debugbear.com/software/best-synthetic-monitoring-tools#pros" class="hash-link" aria-label="Direct link to Pros" title="Direct link to Pros">​</a></h3>
<ul>
<li>Detailed performance metrics for Core Web Vitals, and more</li>
<li>A <a href="https://www.debugbear.com/changelog/may-2024-release-notes#a-new-optimize-tab" target="_blank" rel="noopener noreferrer">wizard</a> to guide you through locating, and fixing performance issues</li>
<li>Offers <a href="https://www.debugbear.com/test/website-speed" target="_blank" rel="noopener noreferrer">free one-off lab tests</a></li>
<li><a href="https://www.youtube.com/watch?v=o0B__FJ5Q3c" target="_blank" rel="noopener noreferrer">One-click performance experiments</a> let you test out performance fixes to measure the impact</li>
</ul>
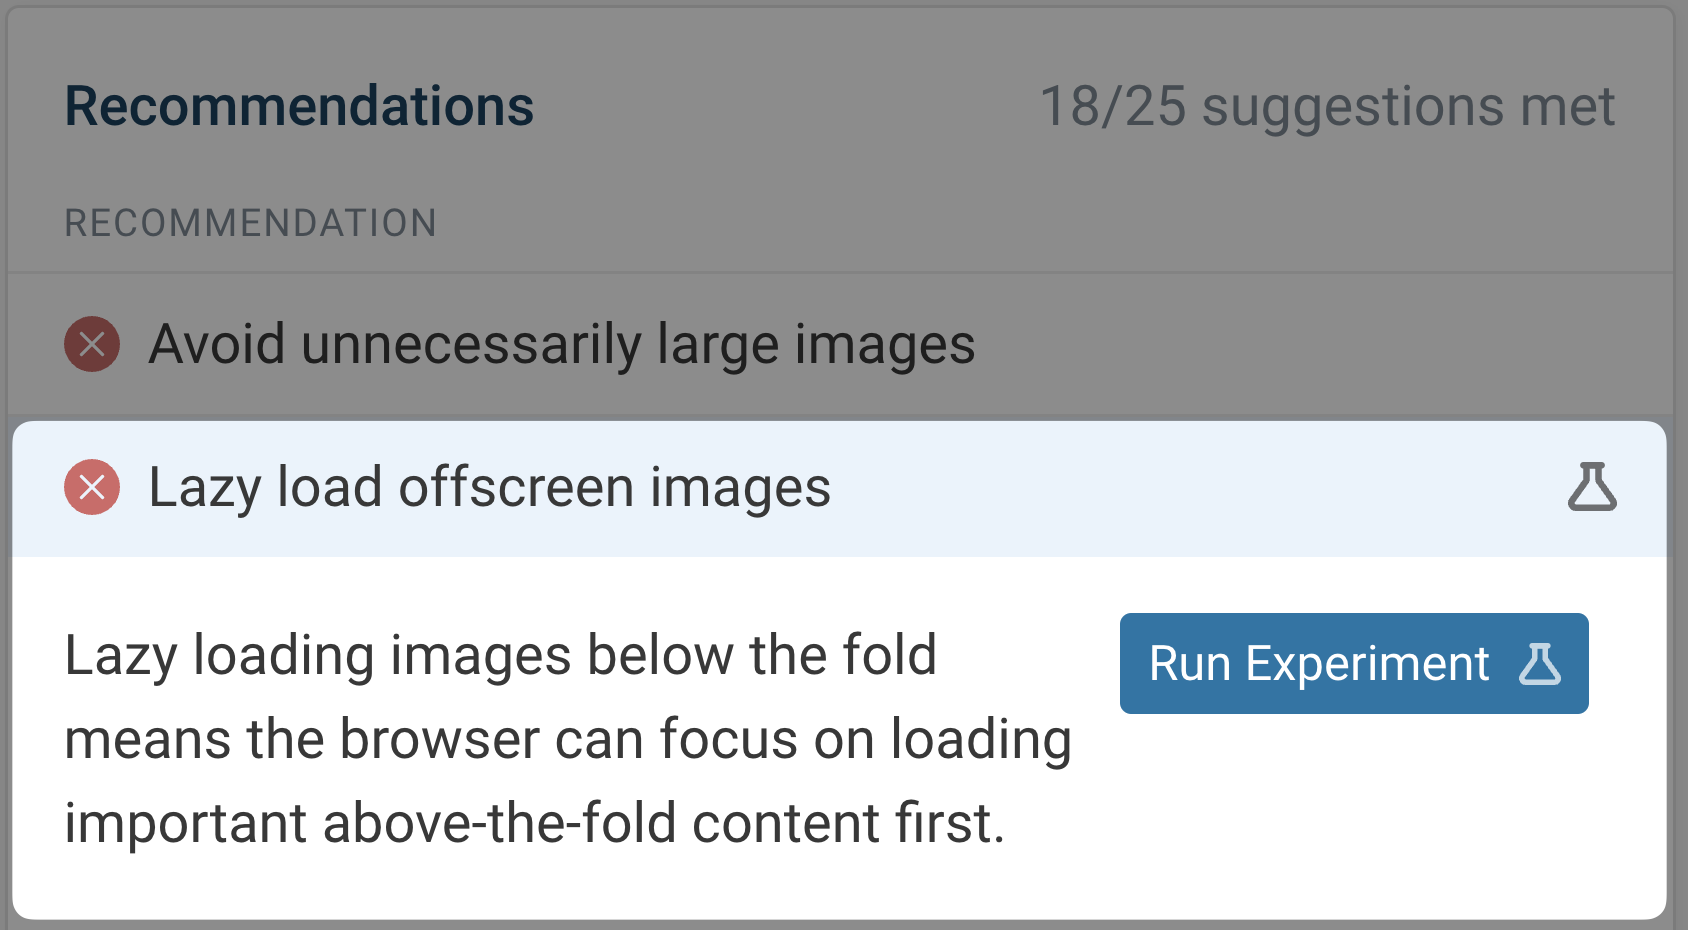
<p>The custom recommendations are based on an analysis of your website. In some cases you can even run an automated experiment to test the change without deploying code to production.</p>
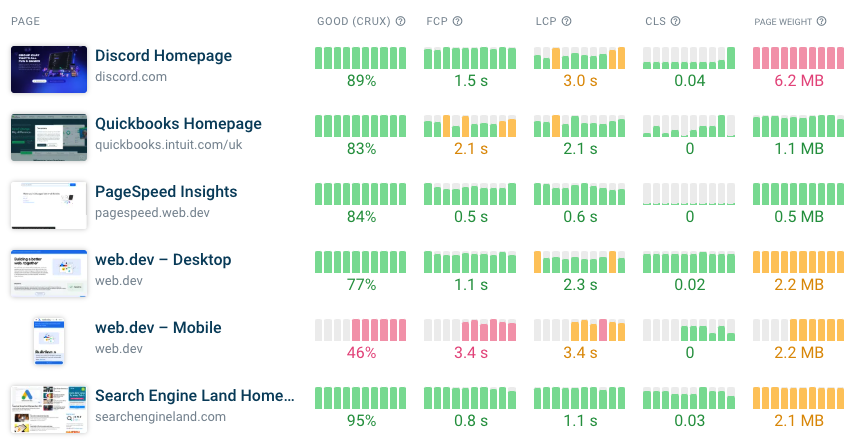
<p><img loading="lazy" src="https://www.debugbear.com/dimg/8fdcb4ef6ecf57b63609bb15ca8b5bc5.png" alt="One click experiments" style="aspect-ratio:1.815;width:100%;max-width:1688px;border-radius:4px" data-abc="true" class="img_CujE"></p>
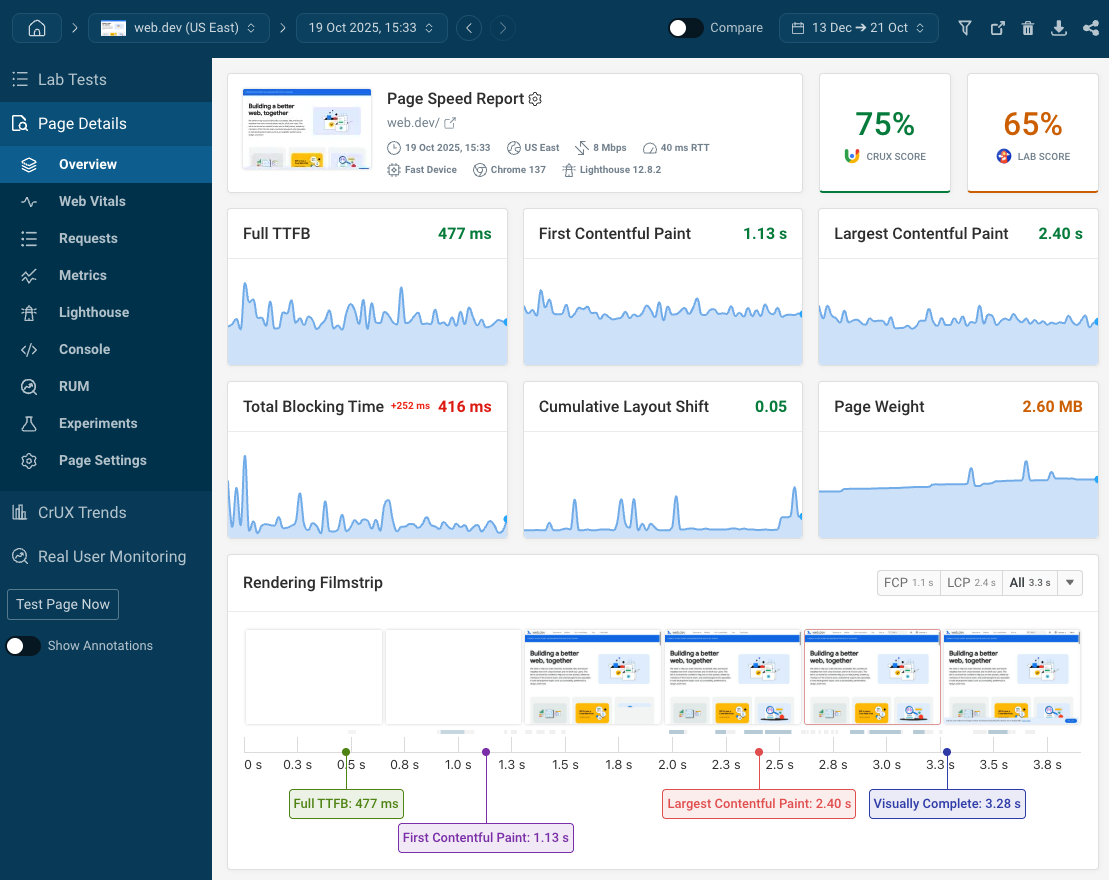
<p>Each tracked URL comes with a more detailed dashboard showing you not just the metrics but also details on how a visitor would experience the website, network requests, and CPU tasks.</p>
<p><img loading="lazy" src="https://www.debugbear.com/dimg/031bf1c470d49f8ad63a394bafa976b6.png" alt="Synthetic monitoring dashboard for a web page" style="border-radius:4px" data-abc="true" class="img_CujE"></p>
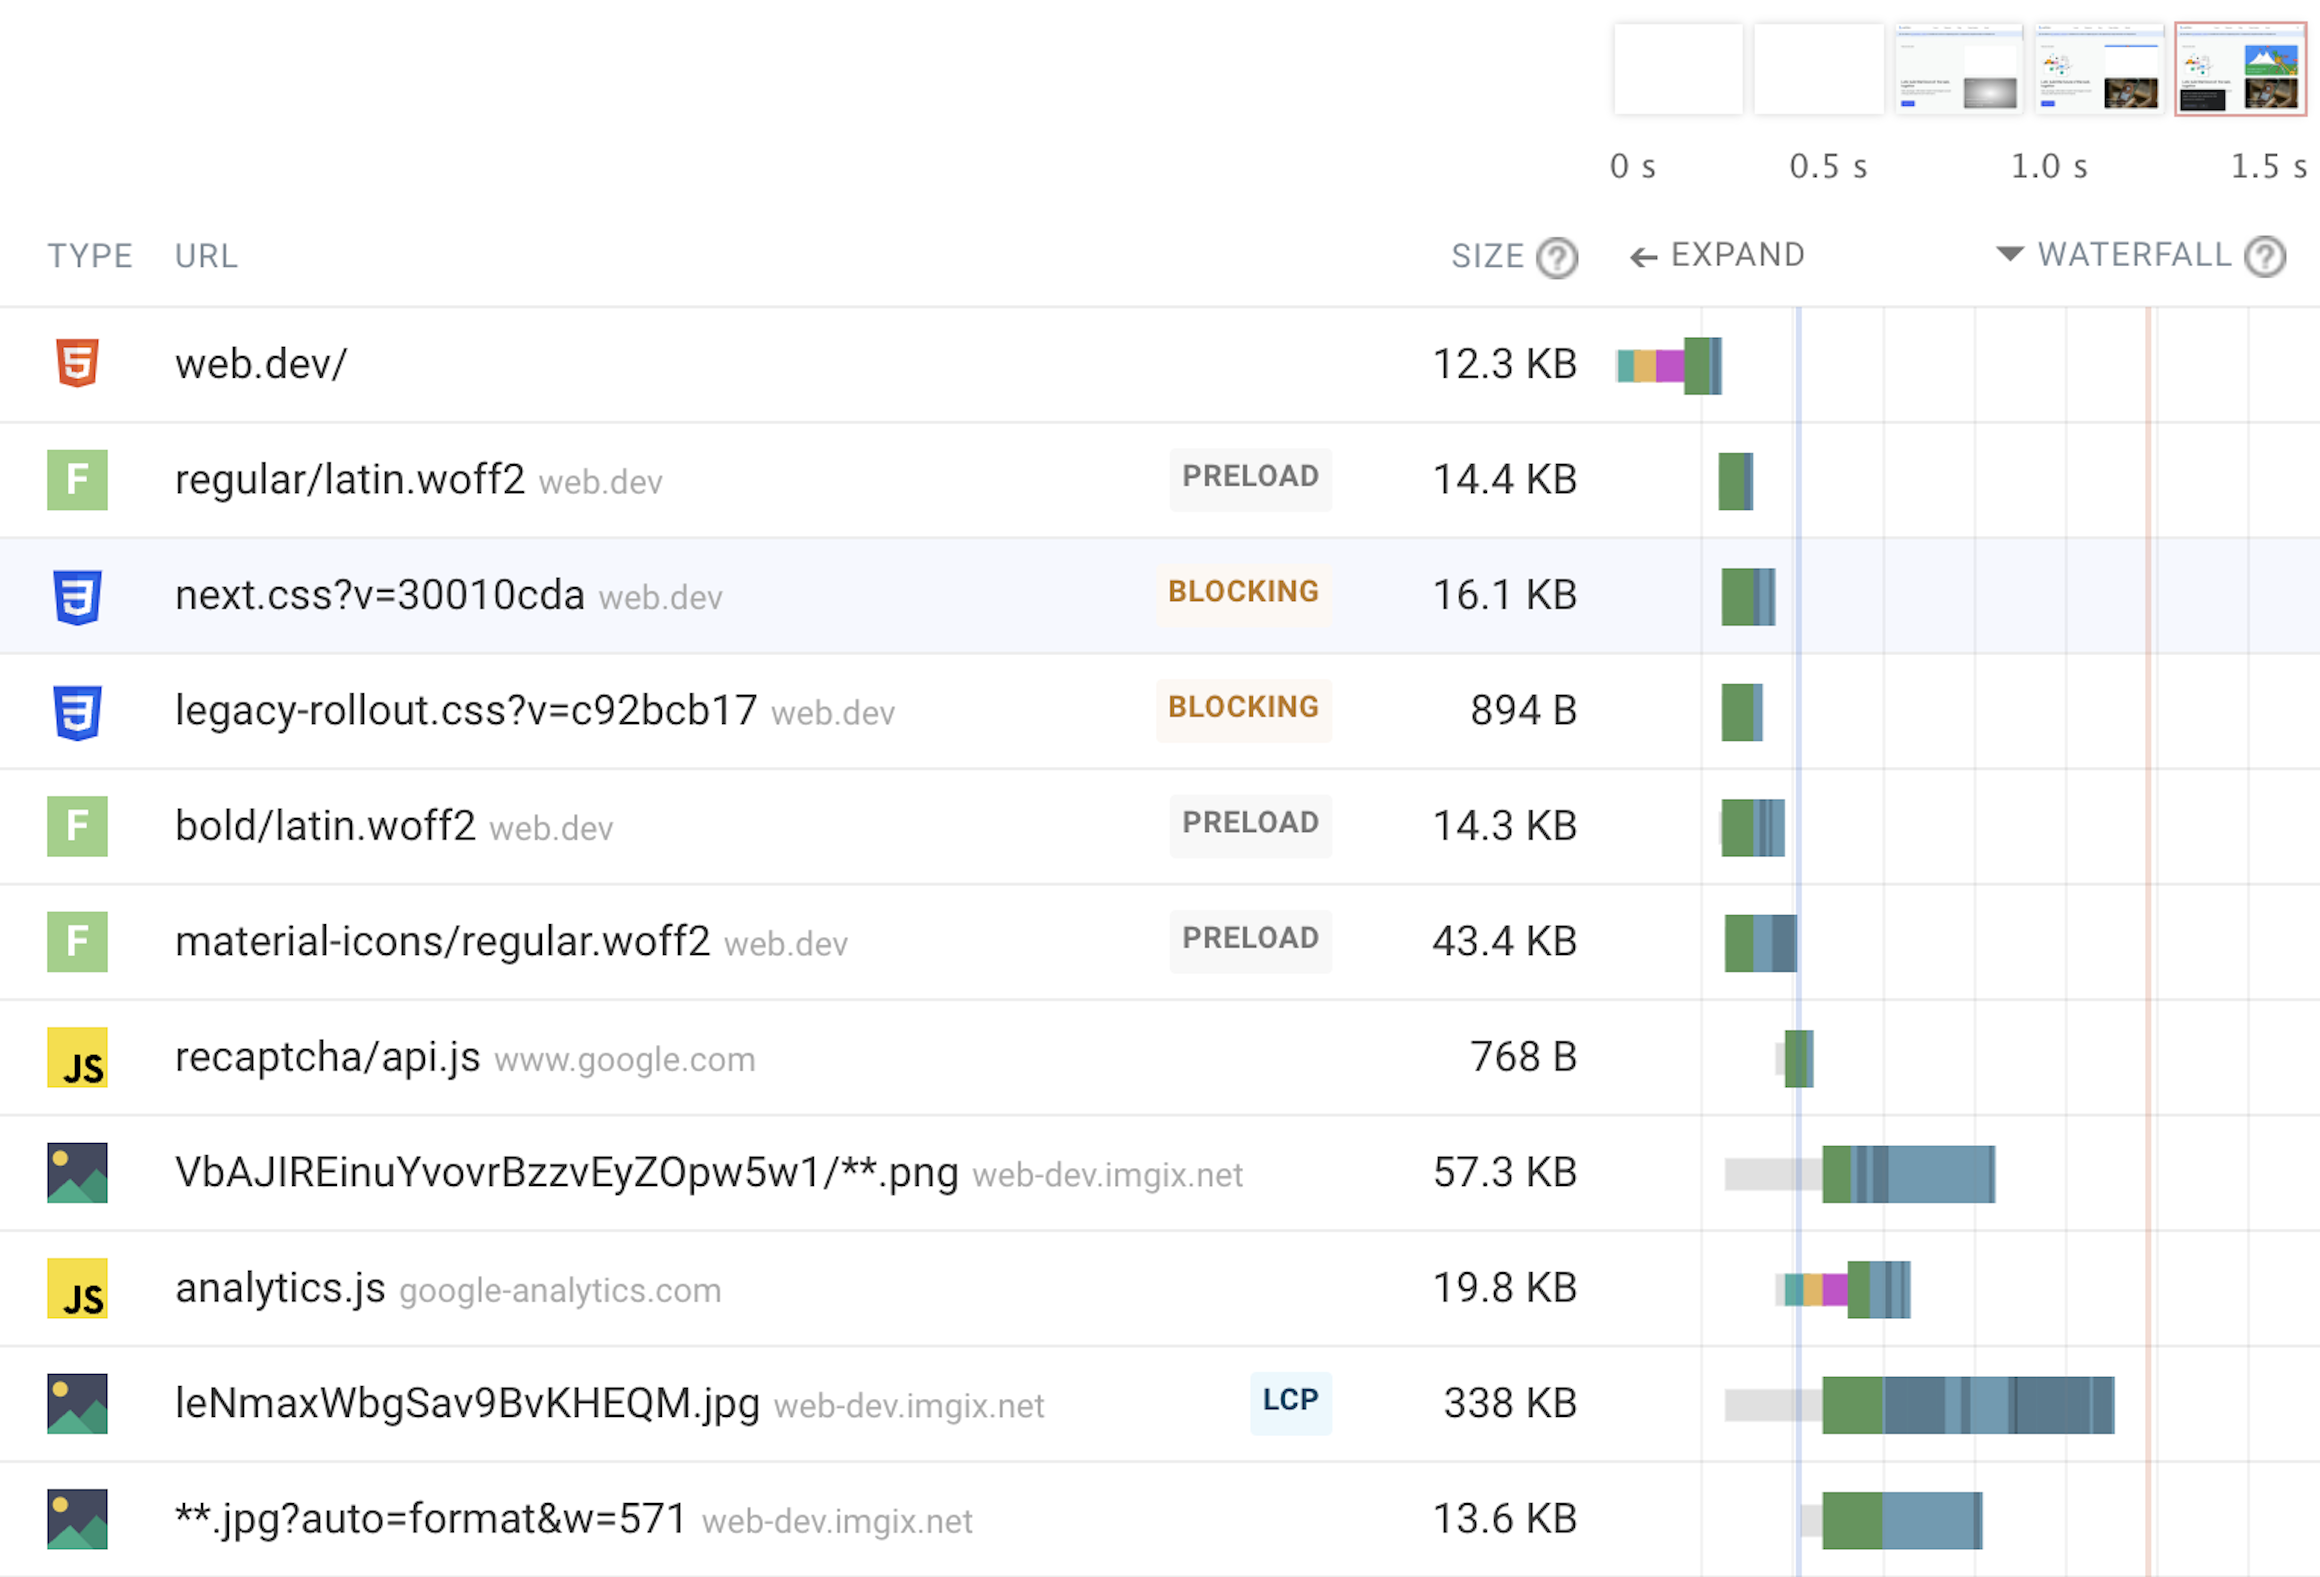
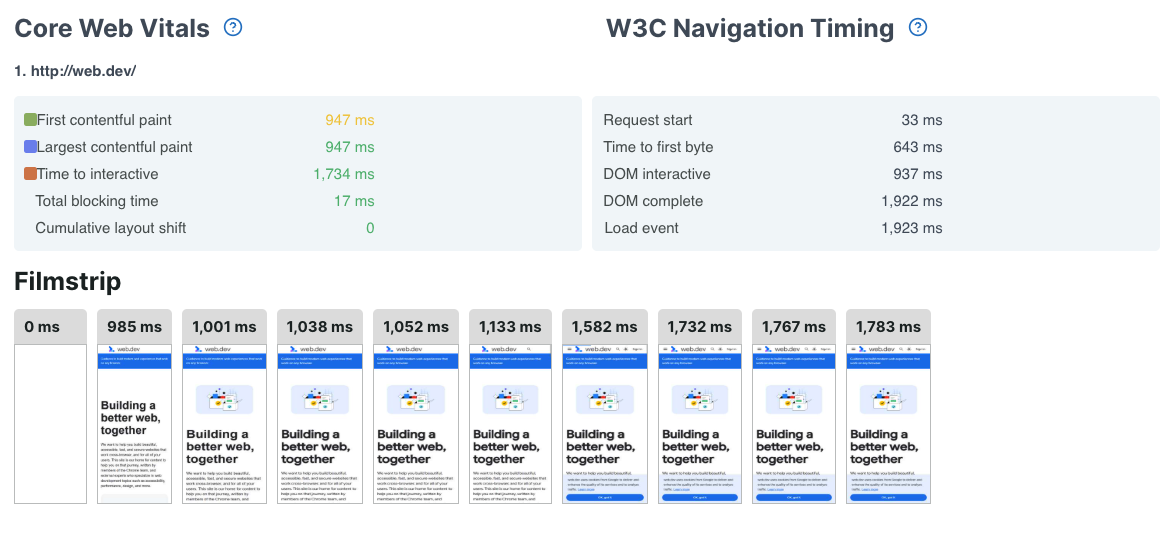
<p>DebugBear features a detailed waterfall view of network requests. This information is vital to debug website performance issues, as you can visually correlate what resources are loading with the content that's showing up in the rendering filmstrip.</p>
<p><img loading="lazy" src="https://dbb.imgix.net/landing/waterfall-new.png?auto=format&amp;dpr=2&amp;width=1160" alt="Detailed reporting and analysis" style="border-radius:4px" data-abc="true" class="img_CujE"></p>
<h3 class="anchor anchorWithStickyNavbar_FNw8" id="cons">Cons<a href="https://www.debugbear.com/software/best-synthetic-monitoring-tools#cons" class="hash-link" aria-label="Direct link to Cons" title="Direct link to Cons">​</a></h3>
<ul>
<li>Can be expensive for small hobby projects</li>
<li>Only focused on frontend performance</li>
</ul>
<h3 class="anchor anchorWithStickyNavbar_FNw8" id="pricing">Pricing<a href="https://www.debugbear.com/software/best-synthetic-monitoring-tools#pricing" class="hash-link" aria-label="Direct link to Pricing" title="Direct link to Pricing">​</a></h3>
<p>Start with a 14-day <a href="https://www.debugbear.com/signup">free trial</a> (no credit card needed) then purchase a subscription starting at $49/mo.</p>
<h2 class="anchor anchorWithStickyNavbar_FNw8" id="2-speedcurve">2. SpeedCurve<a href="https://www.debugbear.com/software/best-synthetic-monitoring-tools#2-speedcurve" class="hash-link" aria-label="Direct link to 2. SpeedCurve" title="Direct link to 2. SpeedCurve">​</a></h2>
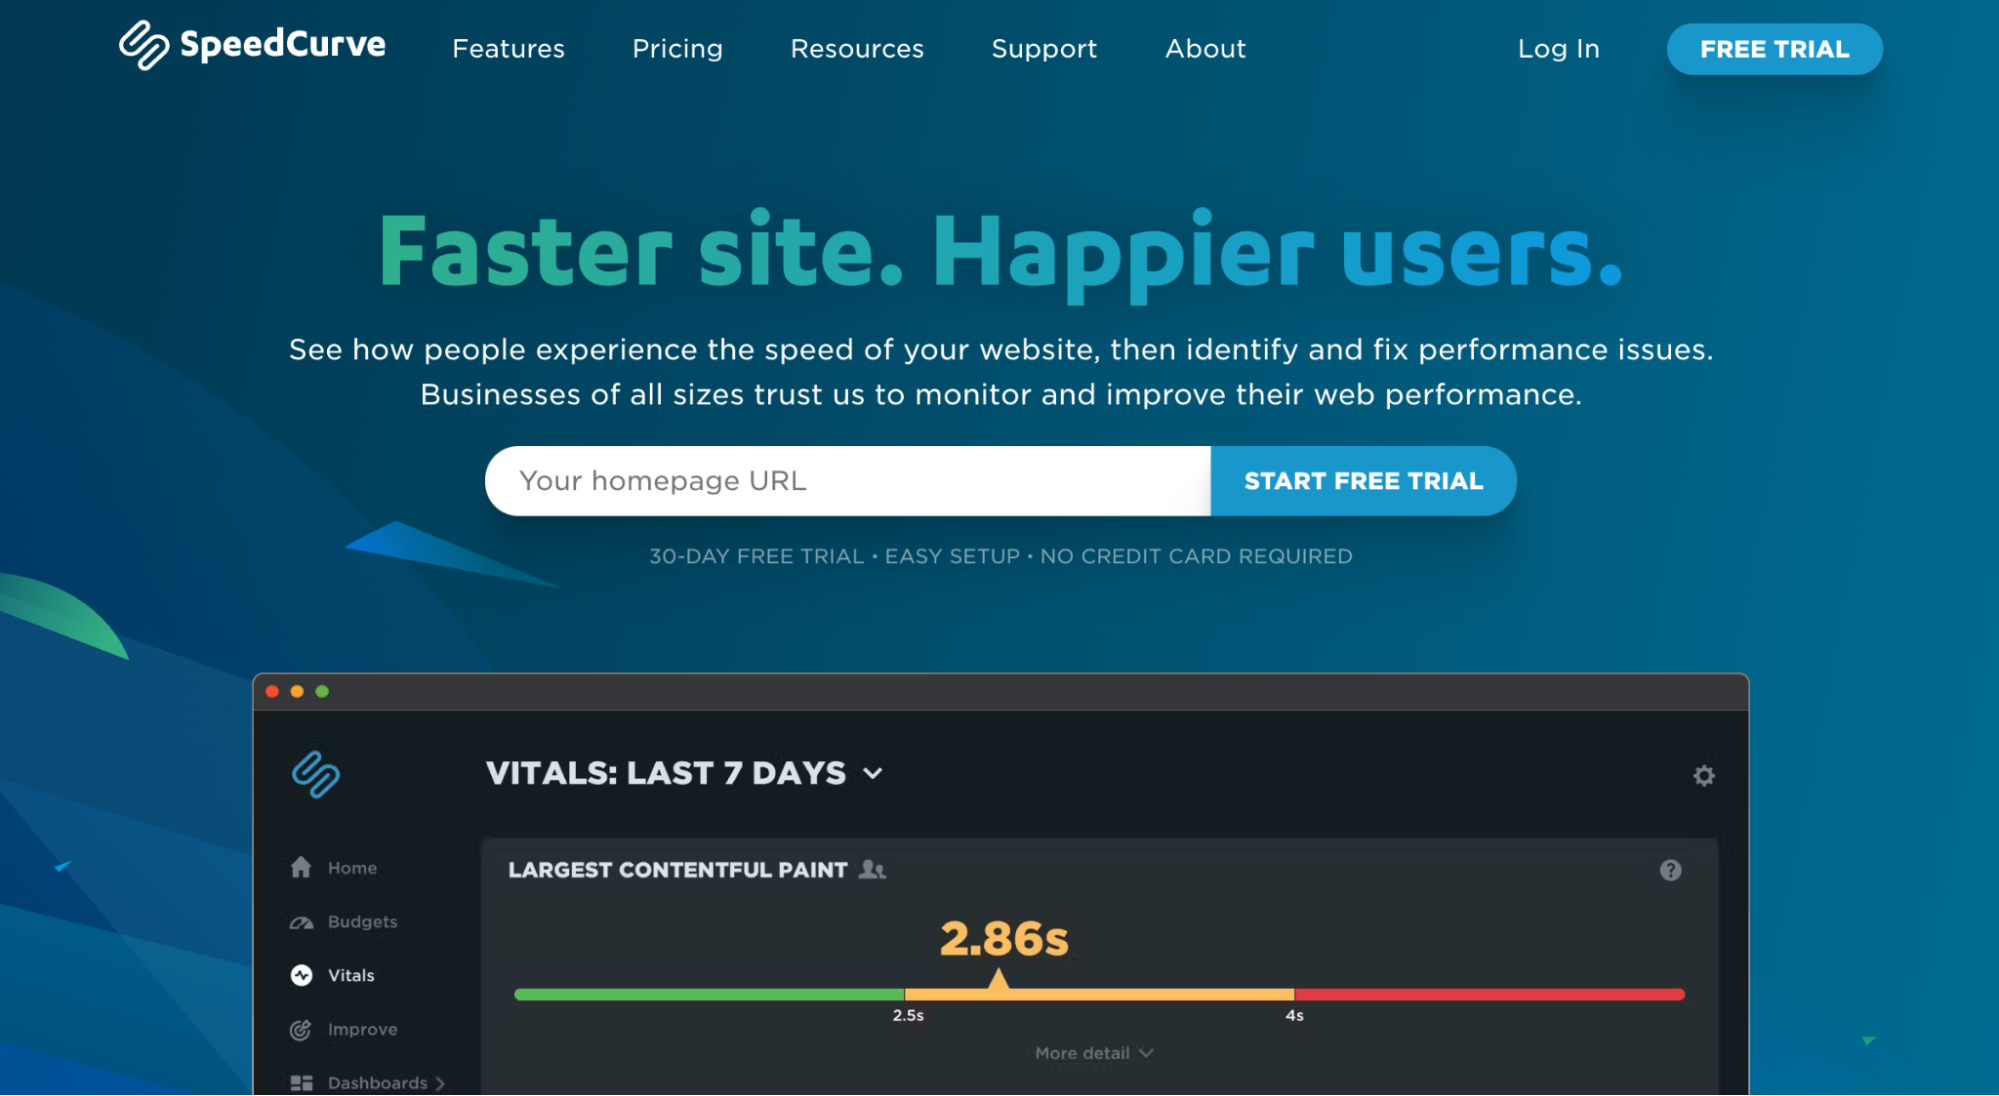
<p>SpeedCurve monitors website performance through synthetic testing and real user monitoring (RUM), helping identify and fix speed issues that affect user experience.</p>
<p><img loading="lazy" src="https://www.debugbear.com/dimg/272353b5a6edd816df51df2660820905.png" alt="SpeedCurve home page" style="border-radius:4px" data-abc="true" class="img_CujE"></p>
<h3 class="anchor anchorWithStickyNavbar_FNw8" id="key-features-1">Key Features<a href="https://www.debugbear.com/software/best-synthetic-monitoring-tools#key-features-1" class="hash-link" aria-label="Direct link to Key Features" title="Direct link to Key Features">​</a></h3>
<ul>
<li>Tracks 100+ performance metrics including Core Web Vitals, Lighthouse scores, and custom metrics</li>
<li>Provides competitor benchmarking capabilities</li>
<li>Integrates with CI/CD workflows through API and performance budgets</li>
<li>Offers real-time alerts for performance threshold violations</li>
</ul>
<h3 class="anchor anchorWithStickyNavbar_FNw8" id="pros-1">Pros<a href="https://www.debugbear.com/software/best-synthetic-monitoring-tools#pros-1" class="hash-link" aria-label="Direct link to Pros" title="Direct link to Pros">​</a></h3>
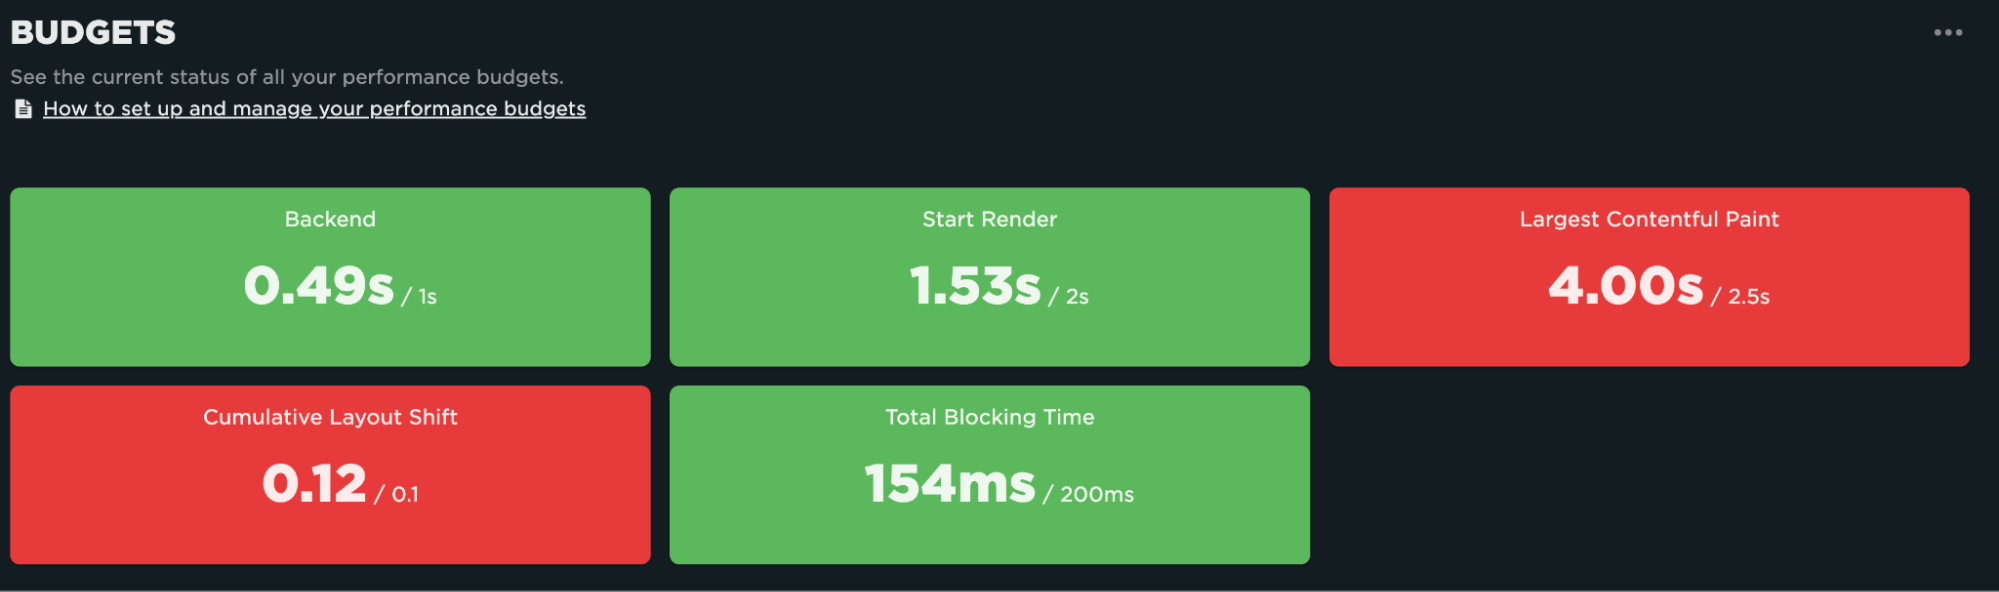
<p>Track website changes through clear visualizations and performance comparisons in an intuitive dashboard. Each deployment includes automated Lighthouse scoring and reporting.</p>
<p>Synthetic test budgets help alert you during performance regressions.</p>
<p><img loading="lazy" src="https://www.debugbear.com/dimg/42d63a5182ebd999844002d89c2abb04.png" alt="The budget section for metrics, in SpeedCurve" style="border-radius:4px" data-abc="true" class="img_CujE"></p>
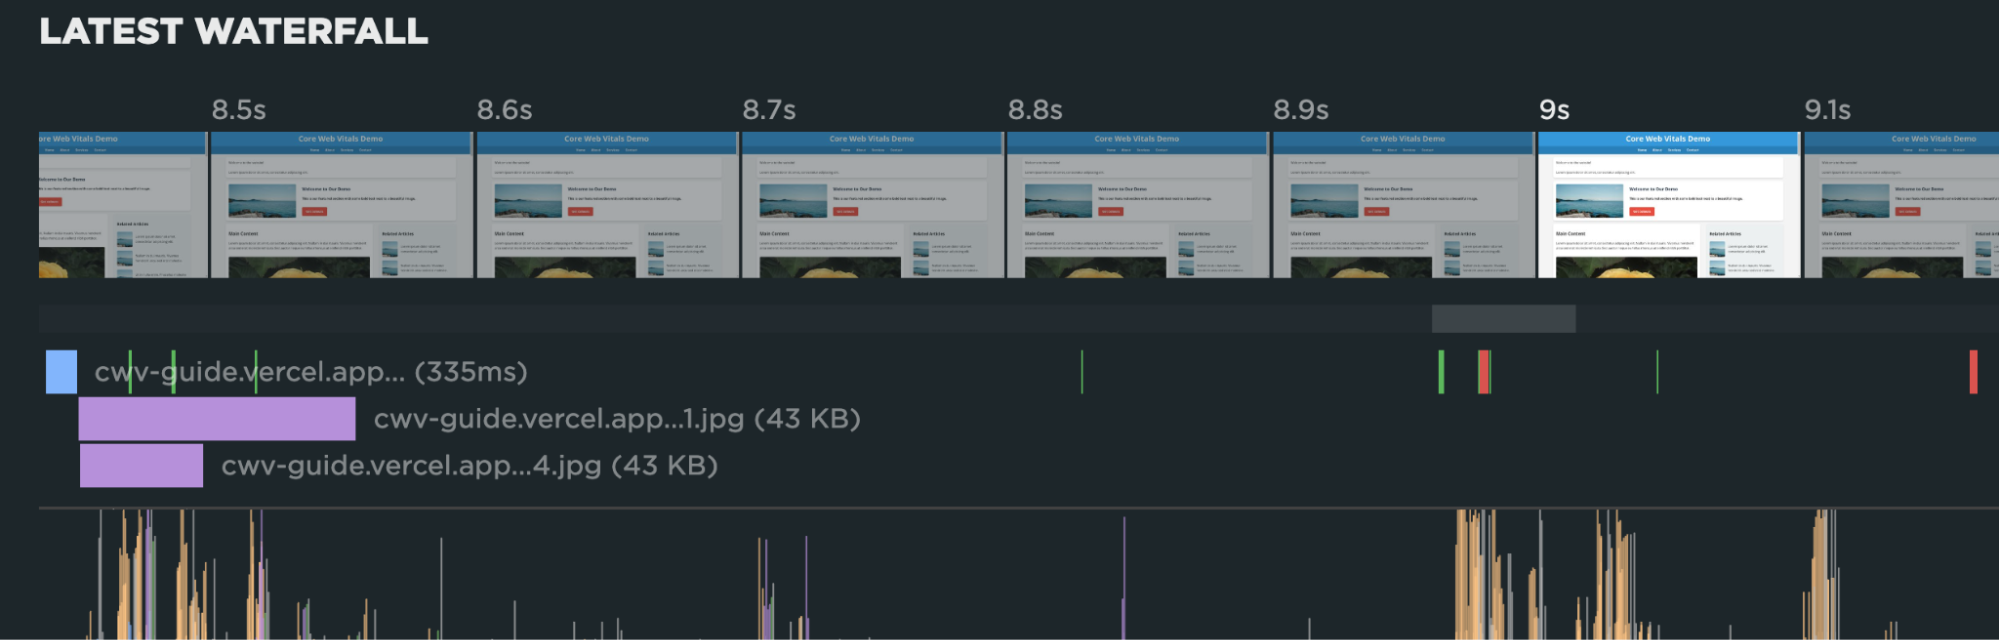
<p>Synthetic lab tests also capture a network request waterfall that includes CPU activity, so you can understand periods of heavy browser processing activity.</p>
<p><img loading="lazy" src="https://www.debugbear.com/dimg/37272dfa019be407e3cba93269513321.png" alt="A waterfall view showing busy CPU activity" style="border-radius:4px" data-abc="true" class="img_CujE"></p>
<h3 class="anchor anchorWithStickyNavbar_FNw8" id="cons-1">Cons<a href="https://www.debugbear.com/software/best-synthetic-monitoring-tools#cons-1" class="hash-link" aria-label="Direct link to Cons" title="Direct link to Cons">​</a></h3>
<p>Oversimplified interface and restricted functionality affect usability. Performance metrics lack granularity, preventing effective troubleshooting of performance issues.</p>
<h3 class="anchor anchorWithStickyNavbar_FNw8" id="pricing-1">Pricing<a href="https://www.debugbear.com/software/best-synthetic-monitoring-tools#pricing-1" class="hash-link" aria-label="Direct link to Pricing" title="Direct link to Pricing">​</a></h3>
<p>Sign up for a free trial, then pay $12 USD monthly for up to 1000 synthetic checks per month on the basic plan.</p>
<h2 class="anchor anchorWithStickyNavbar_FNw8" id="3-datadog">3. Datadog<a href="https://www.debugbear.com/software/best-synthetic-monitoring-tools#3-datadog" class="hash-link" aria-label="Direct link to 3. Datadog" title="Direct link to 3. Datadog">​</a></h2>
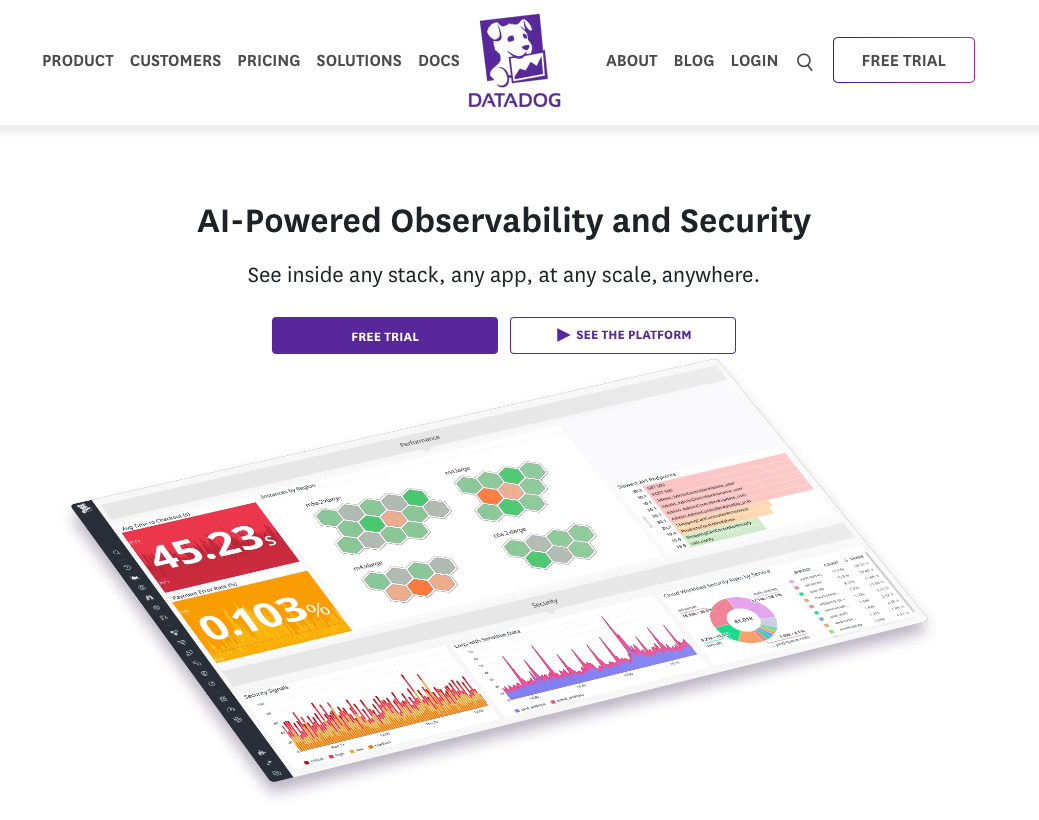
<p>Datadog is a comprehensive website observability platform that includes synthetic monitoring in its service. You can also use it to collect data on real experience.</p>
<p><img loading="lazy" src="https://www.debugbear.com/dimg/0536151691398ee2bfc306691112123b.png" alt="Datadog landing page describing it as an AI-powered observability and security solution" style="border-radius:4px" data-abc="true" class="img_CujE"></p>
<h3 class="anchor anchorWithStickyNavbar_FNw8" id="key-features-2">Key Features<a href="https://www.debugbear.com/software/best-synthetic-monitoring-tools#key-features-2" class="hash-link" aria-label="Direct link to Key Features" title="Direct link to Key Features">​</a></h3>
<ul>
<li>Monitors core web vitals and load times across web applications</li>
<li>Tracks user sessions with replay capability and error tracking</li>
<li>Collects custom metrics and user behavioral data</li>
<li>Correlates frontend issues with backend traces and logs</li>
<li>Provides synthetic browser testing to simulate user journeys</li>
</ul>
<h3 class="anchor anchorWithStickyNavbar_FNw8" id="pros-2">Pros<a href="https://www.debugbear.com/software/best-synthetic-monitoring-tools#pros-2" class="hash-link" aria-label="Direct link to Pros" title="Direct link to Pros">​</a></h3>
<p>Monitor site performance and interaction tests, while also capturing real user web browsing sessions. This captured data reveals how visitors navigate your site and helps identify issues.</p>
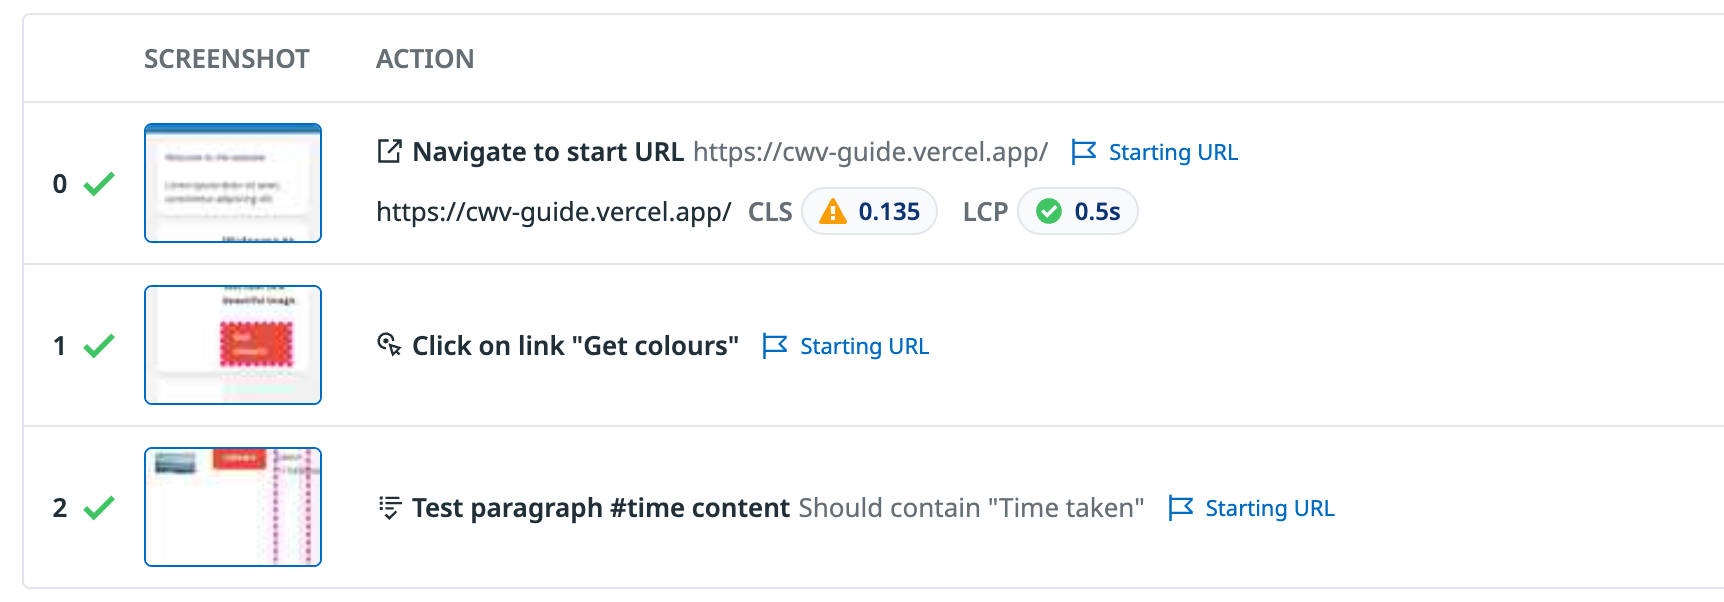
<p>Here's an example of a synthetic browser test that includes a <a href="https://www.debugbear.com/docs/synthetic-transaction-monitoring">scripted user flow</a>:</p>
<p><img loading="lazy" src="https://www.debugbear.com/dimg/55a60b4855f44ee1a60008cecaa61b8d.png" alt="User flow settings for a browser test" style="border-radius:4px" data-abc="true" class="img_CujE"></p>
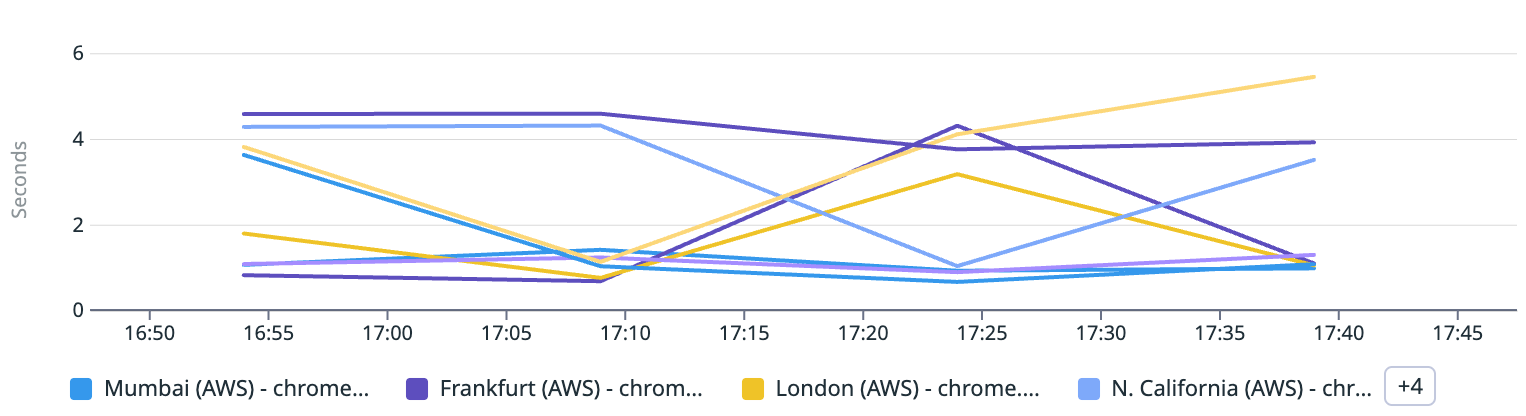
<p>You can use the synthetic tests to monitor performance, uptime, and correctness. Here's a chart showing uptime in different regions over time:</p>
<p><img loading="lazy" src="https://www.debugbear.com/dimg/a6587da01c39246e2ba0c5123627a4ba.png" alt="Chart showing performance for a browser test, across different regions" style="border-radius:4px" data-abc="true" class="img_CujE"></p>
<h3 class="anchor anchorWithStickyNavbar_FNw8" id="cons-2">Cons<a href="https://www.debugbear.com/software/best-synthetic-monitoring-tools#cons-2" class="hash-link" aria-label="Direct link to Cons" title="Direct link to Cons">​</a></h3>
<p>Installing the required tracking agent during onboarding creates confusion and complexity.</p>
<h3 class="anchor anchorWithStickyNavbar_FNw8" id="pricing-2">Pricing<a href="https://www.debugbear.com/software/best-synthetic-monitoring-tools#pricing-2" class="hash-link" aria-label="Direct link to Pricing" title="Direct link to Pricing">​</a></h3>
<p>Start with a free trial, then pay $5 monthly for up to 10,000 synthetic checks.</p>
<h2 class="anchor anchorWithStickyNavbar_FNw8" id="4-pingdom">4. Pingdom<a href="https://www.debugbear.com/software/best-synthetic-monitoring-tools#4-pingdom" class="hash-link" aria-label="Direct link to 4. Pingdom" title="Direct link to 4. Pingdom">​</a></h2>
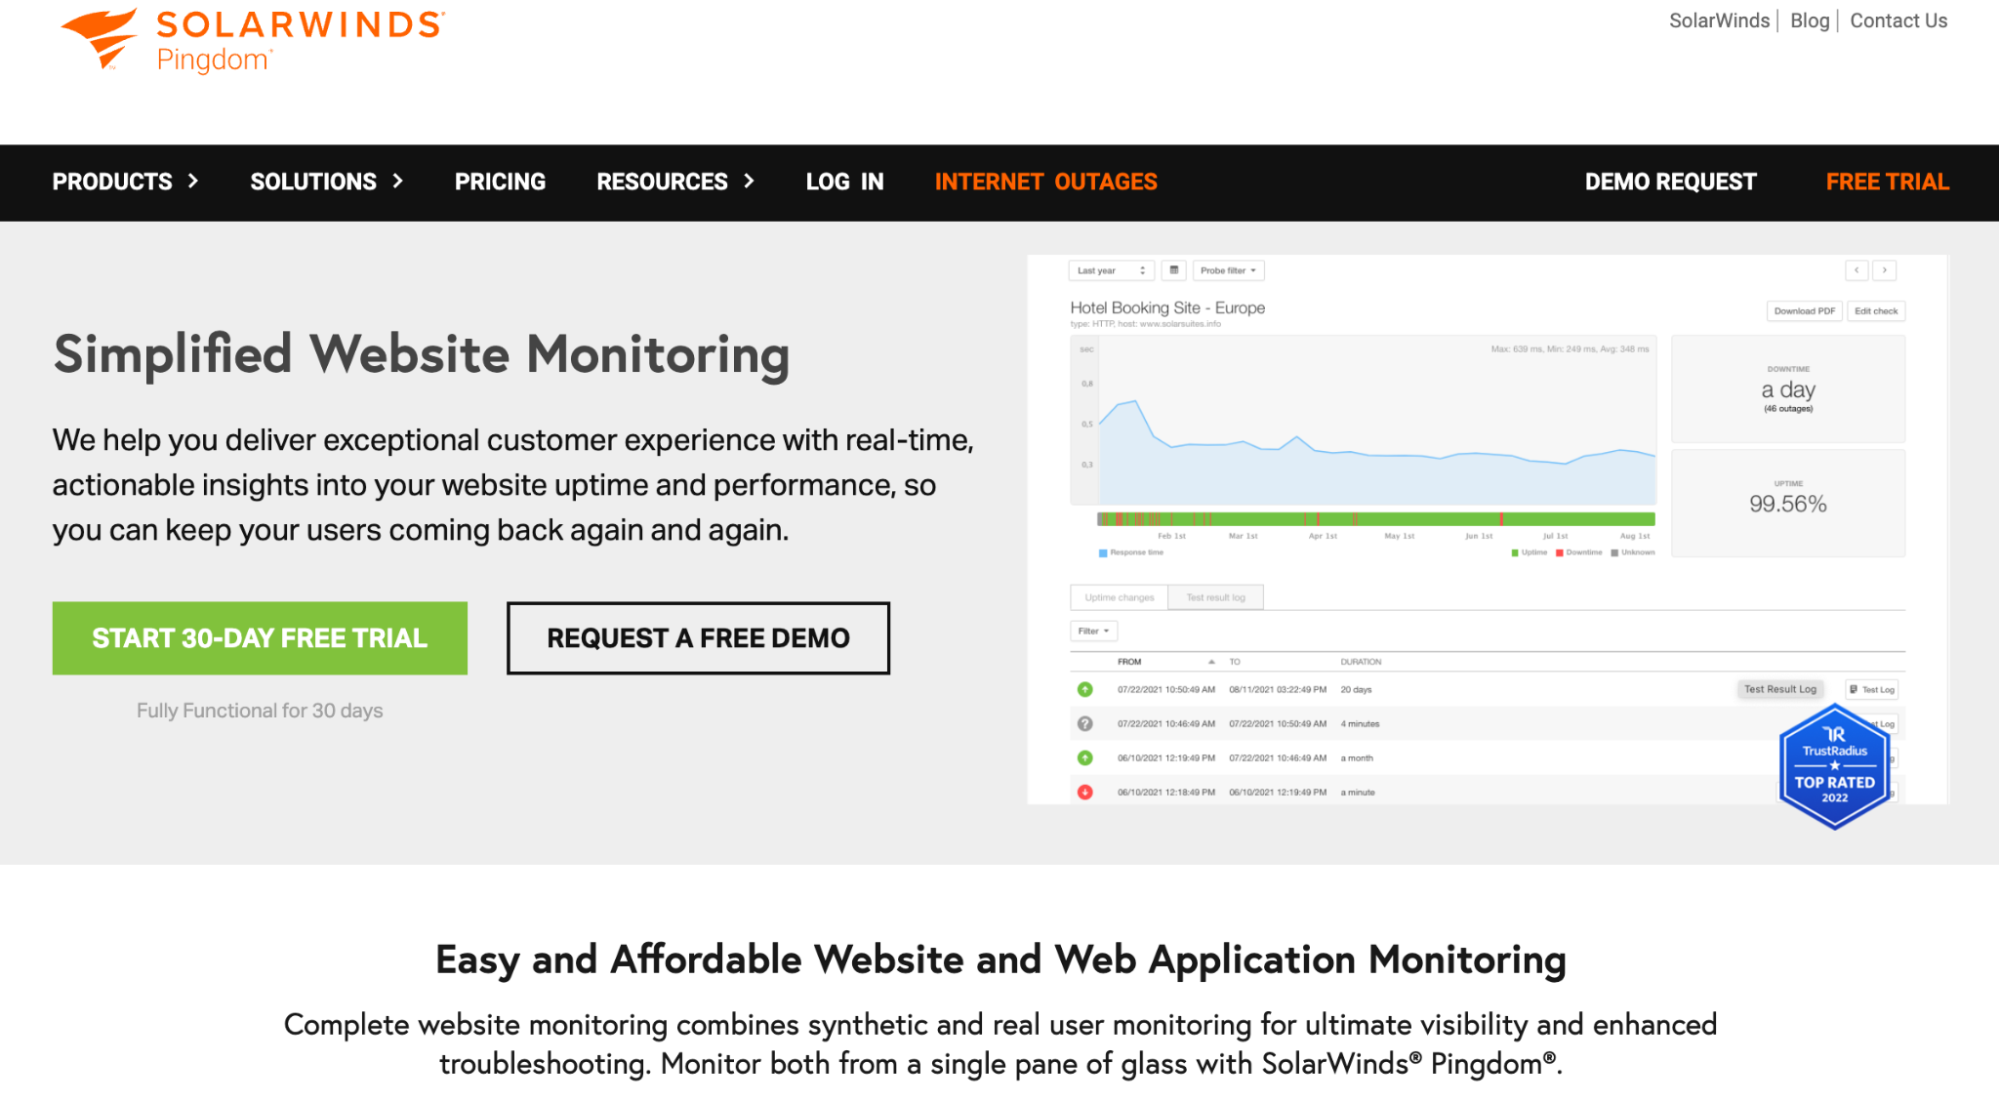
<p><a href="https://www.debugbear.com/software/pingdom-speed-test">Pingdom</a> is a website monitoring service that also includes a real user monitoring service to track end-user interactions and performance metrics on websites, priced starting at $10 per month.</p>
<p><img loading="lazy" src="https://www.debugbear.com/dimg/8786b8d6ff7bd26fef5d08804900a50f.png" alt="Pingdom homepage" style="border-radius:4px" data-abc="true" class="img_CujE"></p>
<h3 class="anchor anchorWithStickyNavbar_FNw8" id="key-features-3">Key Features<a href="https://www.debugbear.com/software/best-synthetic-monitoring-tools#key-features-3" class="hash-link" aria-label="Direct link to Key Features" title="Direct link to Key Features">​</a></h3>
<ul>
<li>Geographic tracking of user activity with live mapping</li>
<li>Performance metrics including load time, time to first byte, and Apdex score</li>
<li>Browser, device, and platform-specific analytics</li>
<li>Customizable performance threshold alerts</li>
<li>Historical trend analysis and comparison</li>
<li>Deployment via single code snippet</li>
</ul>
<h3 class="anchor anchorWithStickyNavbar_FNw8" id="pros-3">Pros<a href="https://www.debugbear.com/software/best-synthetic-monitoring-tools#pros-3" class="hash-link" aria-label="Direct link to Pros" title="Direct link to Pros">​</a></h3>
<p>Records user interactions to create automated tests, monitors site uptime with a shareable status page, and integrates with monitoring tools to provide infrastructure metrics and code-level visibility.</p>
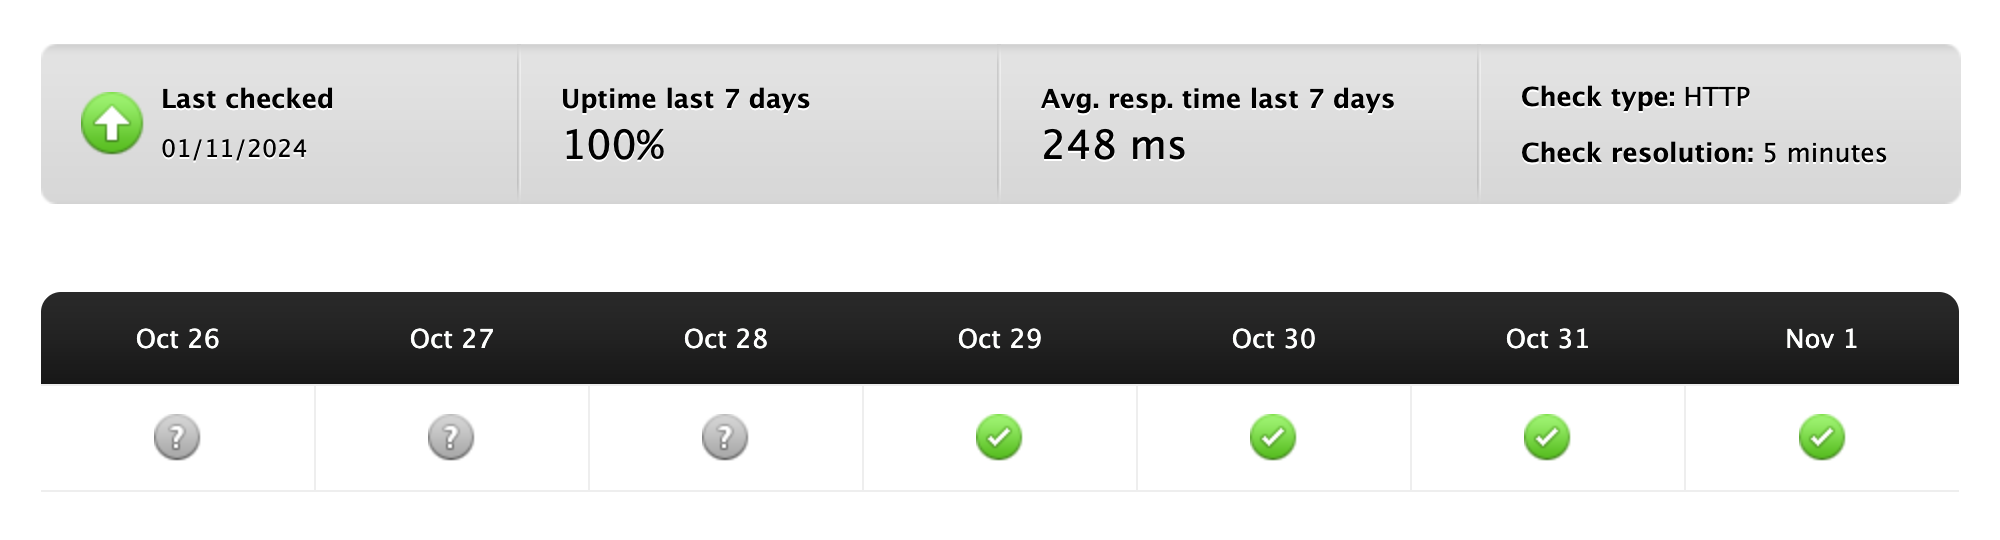
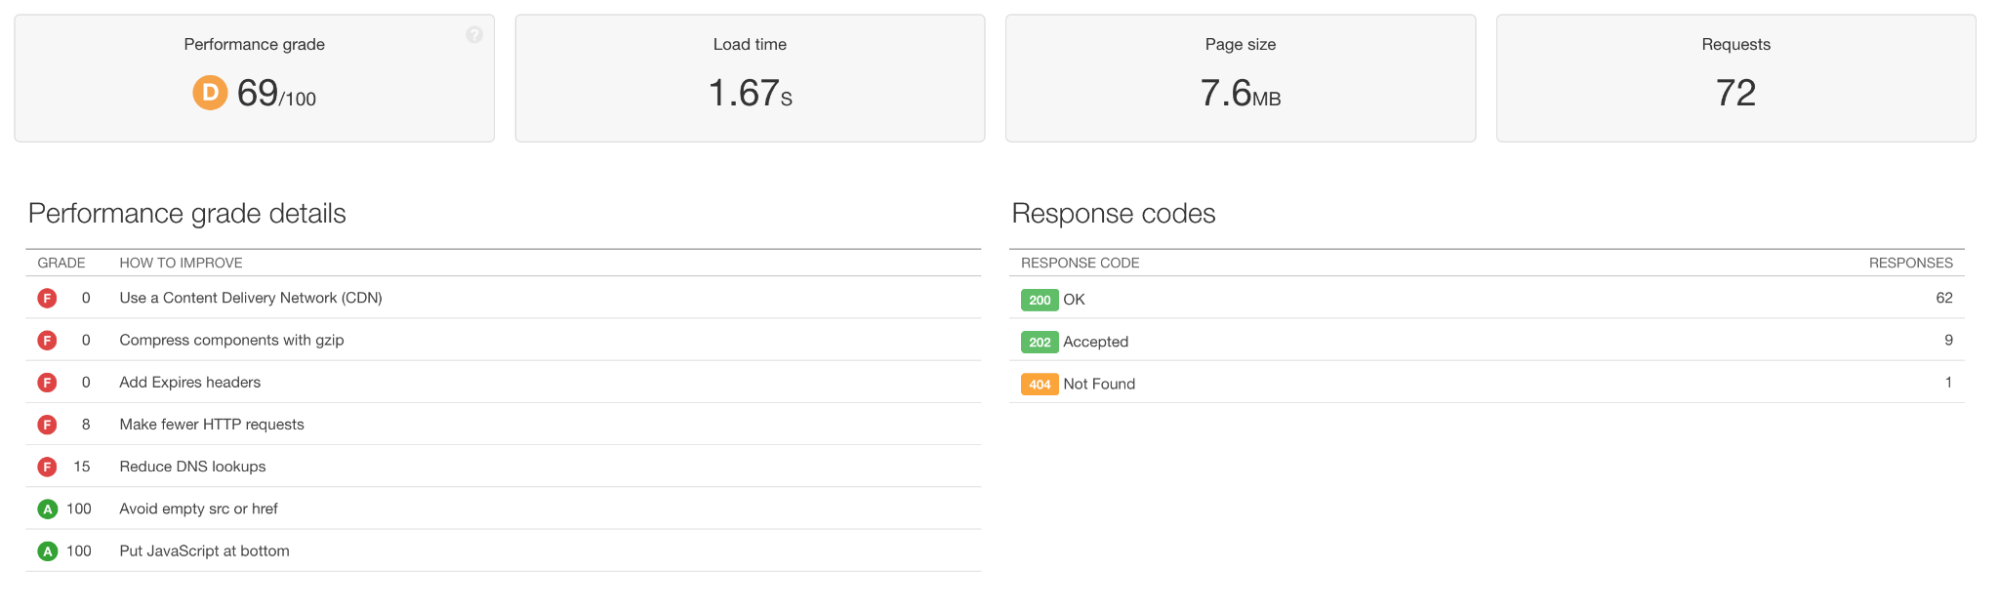
<p>Synthetic uptime checking: Pingdom can also generate status pages for you</p>
<p><img loading="lazy" src="https://www.debugbear.com/dimg/f1edba642c6b4aa3a1a9df197339bd98.png" alt="An automatically generated uptime status page that shows average response time also" style="border-radius:4px" data-abc="true" class="img_CujE"></p>
<p>Synthetic lab-based tests give you a report and recommendations for <a href="https://www.debugbear.com/blog/improve-website-performance">how to improve performance</a>.</p>
<p><img loading="lazy" src="https://www.debugbear.com/dimg/88b835869a64508ec1a6b032c7f5c614.png" alt="Performance recommendations for a website speed test" style="border-radius:4px" data-abc="true" class="img_CujE"></p>
<h3 class="anchor anchorWithStickyNavbar_FNw8" id="cons-3">Cons<a href="https://www.debugbear.com/software/best-synthetic-monitoring-tools#cons-3" class="hash-link" aria-label="Direct link to Cons" title="Direct link to Cons">​</a></h3>
<p>Performance monitoring lacks depth, notably missing Core Web Vitals tracking. Available metrics provide insufficient detail to properly diagnose and debug performance issues.</p>
<h3 class="anchor anchorWithStickyNavbar_FNw8" id="pricing-3">Pricing<a href="https://www.debugbear.com/software/best-synthetic-monitoring-tools#pricing-3" class="hash-link" aria-label="Direct link to Pricing" title="Direct link to Pricing">​</a></h3>
<p>Users can start with a free trial before choosing between $10/month (billed annually) for either 10 uptime checks or 2 transaction checks monthly.</p>
<h2 class="anchor anchorWithStickyNavbar_FNw8" id="5-new-relic">5. New Relic<a href="https://www.debugbear.com/software/best-synthetic-monitoring-tools#5-new-relic" class="hash-link" aria-label="Direct link to 5. New Relic" title="Direct link to 5. New Relic">​</a></h2>
<p>New Relic is a suite of monitoring tools, including a synthetic monitoring service and a real user monitoring service that tracks and analyzes web application performance from the end-user's perspective through browser-side data collection.</p>
<p><img loading="lazy" src="https://www.debugbear.com/dimg/0eb6687e211f461b46e9a8b74f843793.png" alt="New relic home page" style="border-radius:4px" data-abc="true" class="img_CujE"></p>
<h3 class="anchor anchorWithStickyNavbar_FNw8" id="key-features-4">Key Features<a href="https://www.debugbear.com/software/best-synthetic-monitoring-tools#key-features-4" class="hash-link" aria-label="Direct link to Key Features" title="Direct link to Key Features">​</a></h3>
<ul>
<li>Core web vitals tracking (LCP, INP, CLS) for SEO optimization</li>
<li>Error rate monitoring with deployment correlation</li>
<li>Geographic usage patterns and device-specific performance metrics</li>
<li>Browser-specific performance tracking and troubleshooting</li>
<li>Backend service connection through distributed tracing</li>
<li>Real-time alerting for performance indicators</li>
</ul>
<h3 class="anchor anchorWithStickyNavbar_FNw8" id="pros-4">Pros<a href="https://www.debugbear.com/software/best-synthetic-monitoring-tools#pros-4" class="hash-link" aria-label="Direct link to Pros" title="Direct link to Pros">​</a></h3>
<p>Monitor your website and infrastructure while watching user session recordings to correlate logs with on-page events. Track page views with filtered analytics and query dashboard data using AI-powered insights.</p>
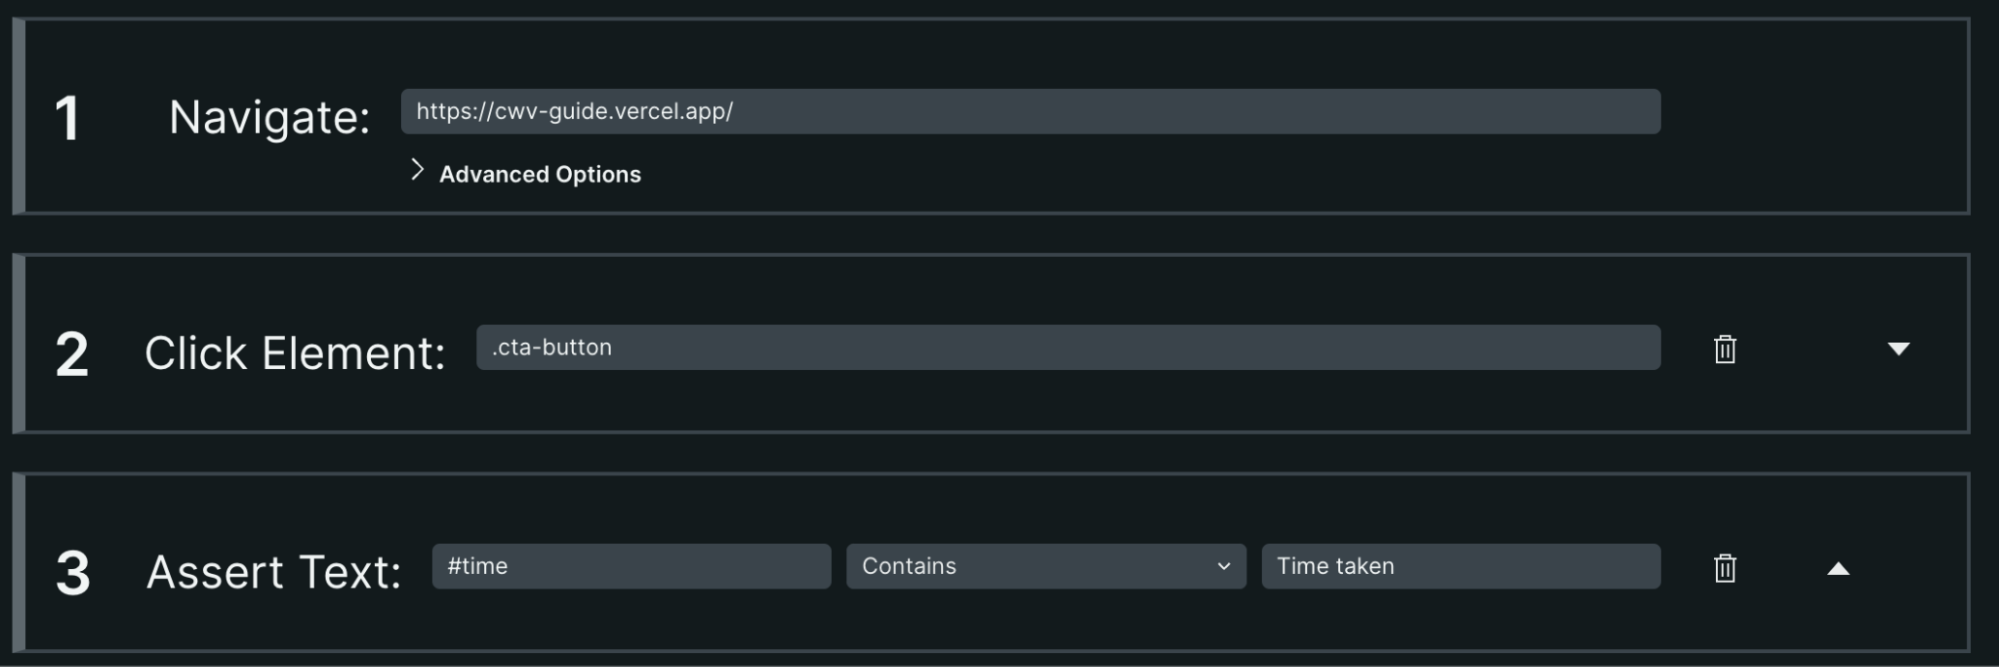
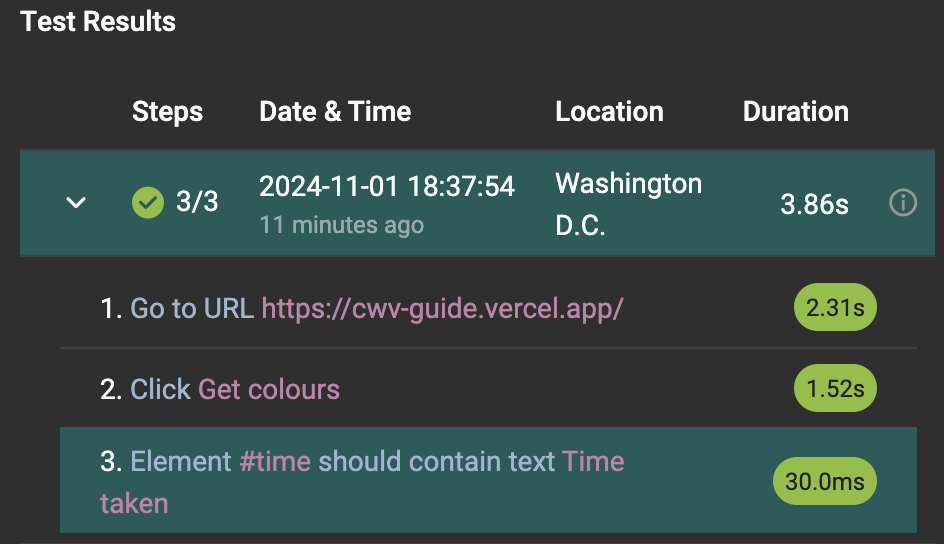
<p>This synthetic test captures the clicking of a call-to-action button, and asserts the page updates as expected:</p>
<p><img loading="lazy" src="https://www.debugbear.com/dimg/18cc1e1755c35a02c40e85e8345ab8b3.png" alt="Configuring a user flow journey as part of a new website check" style="border-radius:4px" data-abc="true" class="img_CujE"></p>
<p>You can dive into specific network request details when looking at a lab test.
Synthetic lab tests capture the usual performance and network related metrics you're likely to expect</p>
<p><img loading="lazy" src="https://www.debugbear.com/dimg/b71474ab48036b6c26837fe71a743b0c.png" alt="Network request details for a particular resource" style="border-radius:4px" data-abc="true" class="img_CujE"></p>
<h3 class="anchor anchorWithStickyNavbar_FNw8" id="cons-4">Cons<a href="https://www.debugbear.com/software/best-synthetic-monitoring-tools#cons-4" class="hash-link" aria-label="Direct link to Cons" title="Direct link to Cons">​</a></h3>
<p>The interface's complexity hinders easy information access. Data analysis lacks depth, particularly for web performance metrics.</p>
<h3 class="anchor anchorWithStickyNavbar_FNw8" id="pricing-4">Pricing<a href="https://www.debugbear.com/software/best-synthetic-monitoring-tools#pricing-4" class="hash-link" aria-label="Direct link to Pricing" title="Direct link to Pricing">​</a></h3>
<p>Start with a free trial and pay based on your usage.</p>
<h2 class="anchor anchorWithStickyNavbar_FNw8" id="6-request-metrics">6. Request Metrics<a href="https://www.debugbear.com/software/best-synthetic-monitoring-tools#6-request-metrics" class="hash-link" aria-label="Direct link to 6. Request Metrics" title="Direct link to 6. Request Metrics">​</a></h2>
<p>Request Metrics is primarily a RUM service that tracks website performance metrics and Core Web Vitals to identify speed issues affecting actual users. It also has some synthetic monitoring capabilities.</p>
<p><img loading="lazy" src="https://www.debugbear.com/dimg/e42801fa3ddea7bb398af1f45349835a.png" alt="Request metrics home page" style="border-radius:4px" data-abc="true" class="img_CujE"></p>
<h3 class="anchor anchorWithStickyNavbar_FNw8" id="key-features-5">Key Features<a href="https://www.debugbear.com/software/best-synthetic-monitoring-tools#key-features-5" class="hash-link" aria-label="Direct link to Key Features" title="Direct link to Key Features">​</a></h3>
<ul>
<li>Real-time performance monitoring of page loads and user interactions</li>
<li>Automatic URL pattern detection and page grouping</li>
<li>Resource waterfall analysis to identify slow-loading assets</li>
<li>Core Web Vitals tracking for SEO optimization</li>
<li>Third-party script impact analysis</li>
<li>Regional performance tracking by country</li>
<li>No-code trial option with performance scanning</li>
</ul>
<h3 class="anchor anchorWithStickyNavbar_FNw8" id="pros-5">Pros<a href="https://www.debugbear.com/software/best-synthetic-monitoring-tools#pros-5" class="hash-link" aria-label="Direct link to Pros" title="Direct link to Pros">​</a></h3>
<p>Monitor and debug Core Web Vitals through detailed interaction analysis, track user journeys step-by-step, and visualize website performance metrics in a clean dashboard interface.</p>
<p>Request Metrics is geared towards real user monitoring, however synthetic lab data is available if you do not have real users yet, for example for a site that has not yet been released.</p>
<p><img loading="lazy" src="https://www.debugbear.com/dimg/5df1b6762779955f726f180e9a7d7805.png" alt="When configuring a new site you can run automated crawls to generate synthetic web performance measurements" style="border-radius:4px" data-abc="true" class="img_CujE"></p>
<h3 class="anchor anchorWithStickyNavbar_FNw8" id="cons-5">Cons<a href="https://www.debugbear.com/software/best-synthetic-monitoring-tools#cons-5" class="hash-link" aria-label="Direct link to Cons" title="Direct link to Cons">​</a></h3>
<p>Useful features are restricted to premium pricing tiers. Synthetic testing remains basic and secondary to the core product.</p>
<h3 class="anchor anchorWithStickyNavbar_FNw8" id="pricing-5">Pricing<a href="https://www.debugbear.com/software/best-synthetic-monitoring-tools#pricing-5" class="hash-link" aria-label="Direct link to Pricing" title="Direct link to Pricing">​</a></h3>
<p>Start with a free trial, then choose from plans starting at $37/month for the Essentials plan.</p>
<h2 class="anchor anchorWithStickyNavbar_FNw8" id="7-solarwinds">7. Solarwinds<a href="https://www.debugbear.com/software/best-synthetic-monitoring-tools#7-solarwinds" class="hash-link" aria-label="Direct link to 7. Solarwinds" title="Direct link to 7. Solarwinds">​</a></h2>
<p>SolarWinds Observability SaaS provides real-time monitoring of web application performance and user experience, combining website metrics with application performance monitoring.</p>
<p><img loading="lazy" src="https://www.debugbear.com/dimg/ca7ab86b98d440a2e10f1217f7997ffa.png" alt="Solarwinds home page" style="border-radius:4px" data-abc="true" class="img_CujE"></p>
<h3 class="anchor anchorWithStickyNavbar_FNw8" id="key-features-6">Key Features<a href="https://www.debugbear.com/software/best-synthetic-monitoring-tools#key-features-6" class="hash-link" aria-label="Direct link to Key Features" title="Direct link to Key Features">​</a></h3>
<ul>
<li>Real-time tracking of page speed, uptime metrics, and user experience by region, device, and browser</li>
<li>Integration with <a href="https://www.debugbear.com/blog/types-of-monitoring#application-performance-monitoring-apm">APM</a> for combined client-side and server-side monitoring</li>
<li>Performance analysis through customizable alerts and Apdex satisfaction ratings</li>
<li>Root cause identification through transaction traces and database query analysis</li>
<li>Single interface monitoring of end-user experience, application servers, infrastructure, and databases</li>
</ul>
<h3 class="anchor anchorWithStickyNavbar_FNw8" id="pros-6">Pros<a href="https://www.debugbear.com/software/best-synthetic-monitoring-tools#pros-6" class="hash-link" aria-label="Direct link to Pros" title="Direct link to Pros">​</a></h3>
<p>Monitor user transactions and verify journey functionality while tracking logs across your application, infrastructure, and database. Analyze and filter data through customizable reporting tools.</p>
<p>Synthetic transaction monitoring lets you capture critical user journeys in your web application:</p>
<p><img loading="lazy" src="https://www.debugbear.com/dimg/8ee9ed174ed0ff96afb09d65017af78f.png" alt="A website test result showing the individual steps which were carried out" style="border-radius:4px" data-abc="true" class="img_CujE"></p>
<p>Synthetic tests can originate from a number of different regions, helping you understand what performance looks like from across the world.</p>
<p><img loading="lazy" src="https://www.debugbear.com/dimg/ad535c504fb7eb1346285424e3abfb3f.png" alt="A list of regions with additional metadata for each region" style="border-radius:4px" data-abc="true" class="img_CujE"></p>
<h3 class="anchor anchorWithStickyNavbar_FNw8" id="cons-6">Cons<a href="https://www.debugbear.com/software/best-synthetic-monitoring-tools#cons-6" class="hash-link" aria-label="Direct link to Cons" title="Direct link to Cons">​</a></h3>
<p>The complex interface and dashboard structure hinders information discovery and access. Limited performance metrics obscure problem diagnosis and root cause analysis. Core Web Vitals data is incomplete, specifically missing Interaction to Next Paint measurements.</p>
<h3 class="anchor anchorWithStickyNavbar_FNw8" id="pricing-6">Pricing<a href="https://www.debugbear.com/software/best-synthetic-monitoring-tools#pricing-6" class="hash-link" aria-label="Direct link to Pricing" title="Direct link to Pricing">​</a></h3>
<p>Users can start with a free trial before choosing between $10/month (billed annually) for either 10 uptime checks or 2 transaction checks monthly.</p>
<h2 class="anchor anchorWithStickyNavbar_FNw8" id="8-atatus">8. Atatus<a href="https://www.debugbear.com/software/best-synthetic-monitoring-tools#8-atatus" class="hash-link" aria-label="Direct link to 8. Atatus" title="Direct link to 8. Atatus">​</a></h2>
<p>A monitoring solution that tracks end-user experience and frontend performance metrics for web applications in real-time.</p>
<p><img loading="lazy" src="https://www.debugbear.com/dimg/7e18a5a264eba964ac9ce02b0a1f0372.png" alt="Atatus home page" style="border-radius:4px" data-abc="true" class="img_CujE"></p>
<h3 class="anchor anchorWithStickyNavbar_FNw8" id="key-features-7">Key Features<a href="https://www.debugbear.com/software/best-synthetic-monitoring-tools#key-features-7" class="hash-link" aria-label="Direct link to Key Features" title="Direct link to Key Features">​</a></h3>
<ul>
<li>Web vitals monitoring (FID, LCP, FCP, INP, TTFB, CLS)</li>
<li>Page load performance tracking with resource waterfall analysis</li>
<li>Single page application (SPA) route change monitoring</li>
<li>AJAX performance tracking</li>
<li>JavaScript error detection and diagnosis</li>
<li>User session replay and journey mapping</li>
<li>Deployment impact measurement</li>
</ul>
<h3 class="anchor anchorWithStickyNavbar_FNw8" id="pros-7">Pros<a href="https://www.debugbear.com/software/best-synthetic-monitoring-tools#pros-7" class="hash-link" aria-label="Direct link to Pros" title="Direct link to Pros">​</a></h3>
<p>Track website performance through analytics dashboards that monitor usage patterns, code deployments, and network statistics. Link deployment changes directly to performance regressions.</p>
<p>In lab-based synthetic tests, you get helpful charts and visualizations to show how your website is performing over time, when accessed from one particular location.</p>
<p><img loading="lazy" src="https://www.debugbear.com/dimg/6c838a314374a51b6e030e4a4305dd8b.png" alt="A response time by location chart" style="border-radius:4px" data-abc="true" class="img_CujE"></p>
<p>Atatus offers a number of useful synthetic test measurements:</p>
<p><img loading="lazy" src="https://www.debugbear.com/dimg/b6d1d10dc49ca3dffb5213d7be7cc8aa.png" alt="Options when creating a new synthetic check which include an API or web check and a multi-step API check" style="border-radius:4px" data-abc="true" class="img_CujE"></p>
<h3 class="anchor anchorWithStickyNavbar_FNw8" id="cons-7">Cons<a href="https://www.debugbear.com/software/best-synthetic-monitoring-tools#cons-7" class="hash-link" aria-label="Direct link to Cons" title="Direct link to Cons">​</a></h3>
<p>Performance metrics, especially Core Web Vitals, lack detailed data to diagnose and troubleshoot low scores. This limited visibility hinders accurate performance analysis and improvement efforts.</p>
<h3 class="anchor anchorWithStickyNavbar_FNw8" id="pricing-7">Pricing<a href="https://www.debugbear.com/software/best-synthetic-monitoring-tools#pricing-7" class="hash-link" aria-label="Direct link to Pricing" title="Direct link to Pricing">​</a></h3>
<p>Start with a 14-day free trial, then pay $2/month for up to 10,000 synthetic checks monthly.</p>
<h2 class="anchor anchorWithStickyNavbar_FNw8" id="9-calibre">9. Calibre<a href="https://www.debugbear.com/software/best-synthetic-monitoring-tools#9-calibre" class="hash-link" aria-label="Direct link to 9. Calibre" title="Direct link to 9. Calibre">​</a></h2>
<p>Calibre is a web performance monitoring platform to track Core Web Vitals and other performance metrics.</p>
<h3 class="anchor anchorWithStickyNavbar_FNw8" id="key-features-8">Key Features<a href="https://www.debugbear.com/software/best-synthetic-monitoring-tools#key-features-8" class="hash-link" aria-label="Direct link to Key Features" title="Direct link to Key Features">​</a></h3>
<ul>
<li>Core Web Vitals monitoring using Chrome User Experience Report data</li>
<li>Performance budgets with alerts via email and Slack</li>
<li>CI/CD integration for pull request performance reviews</li>
<li>Third-party impact analysis and JavaScript task monitoring</li>
<li>API access through Node.js and CLI tools for automation</li>
</ul>
<h3 class="anchor anchorWithStickyNavbar_FNw8" id="pros-8">Pros<a href="https://www.debugbear.com/software/best-synthetic-monitoring-tools#pros-8" class="hash-link" aria-label="Direct link to Pros" title="Direct link to Pros">​</a></h3>
<p>Includes a simple user interface to view basic performance data of the specified website.</p>
<p>Synthetic monitoring in Calibre gives a big focus on performance metrics, such as Core Web Vitals.</p>
<p><img loading="lazy" src="https://www.debugbear.com/dimg/b8d8585b31fa00a522c09f11c02044ab.png" alt="Core Web Vitals metrics shown for a website speed check" style="border-radius:4px" data-abc="true" class="img_CujE"></p>
<p>You can set budgets for your synthetic tests. This can alert you when scores are below a certain threshold.</p>
<p><img loading="lazy" src="https://www.debugbear.com/dimg/da37428695686037ef6336d3c9335311.png" alt="Options presented to set a budget for a metric" style="border-radius:4px" data-abc="true" class="img_CujE"></p>
<h3 class="anchor anchorWithStickyNavbar_FNw8" id="cons-8">Cons<a href="https://www.debugbear.com/software/best-synthetic-monitoring-tools#cons-8" class="hash-link" aria-label="Direct link to Cons" title="Direct link to Cons">​</a></h3>
<p>The service displays limited real-user data from Google CrUX dataset and shows nothing if your site isn't included there. Performance insights don't extend beyond basic Lighthouse metrics.</p>
<h3 class="anchor anchorWithStickyNavbar_FNw8" id="pricing-8">Pricing<a href="https://www.debugbear.com/software/best-synthetic-monitoring-tools#pricing-8" class="hash-link" aria-label="Direct link to Pricing" title="Direct link to Pricing">​</a></h3>
<p>Start with a free trial, then pay $75 USD monthly for up to 5000 synthetic checks.</p>
<h2 class="anchor anchorWithStickyNavbar_FNw8" id="how-to-choose-a-synthetic-monitoring-tool">How to choose a synthetic monitoring tool<a href="https://www.debugbear.com/software/best-synthetic-monitoring-tools#how-to-choose-a-synthetic-monitoring-tool" class="hash-link" aria-label="Direct link to How to choose a synthetic monitoring tool" title="Direct link to How to choose a synthetic monitoring tool">​</a></h2>
<p>When choosing a synthetic monitoring tool, consider the following factors:</p>
<ul>
<li>Supported metrics</li>
<li>Global test locations</li>
<li>Data quality</li>
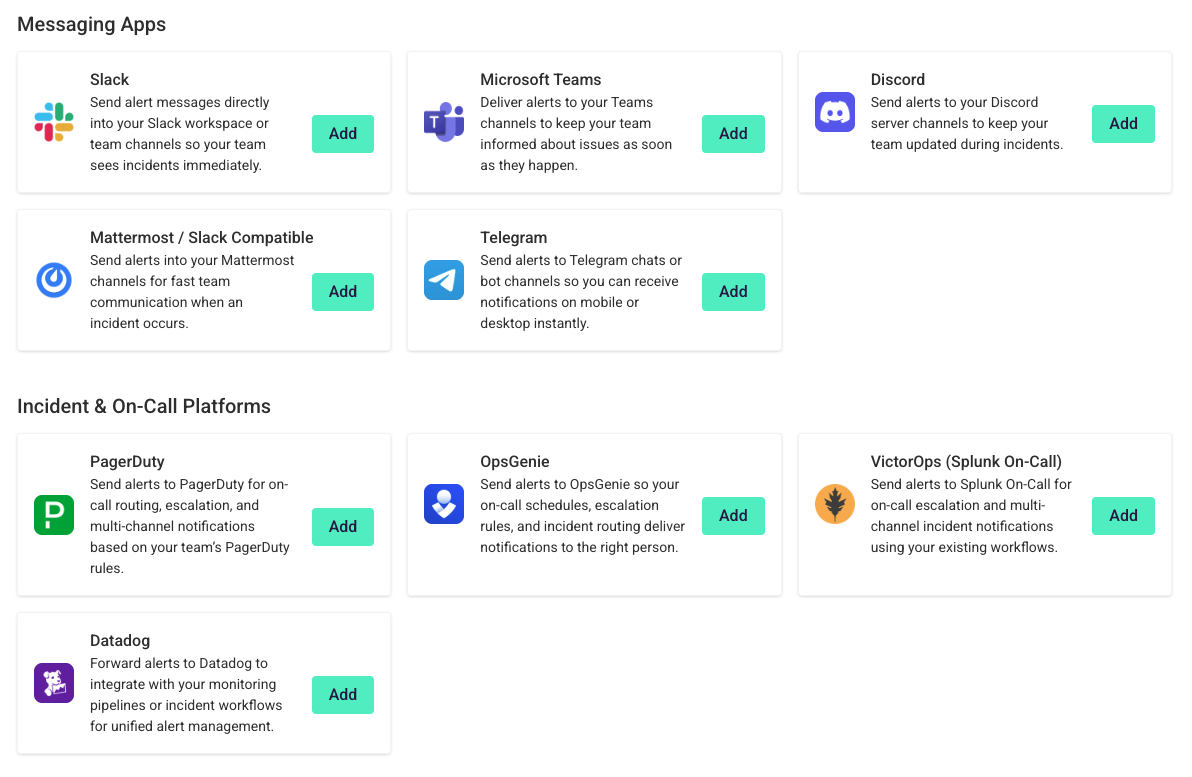
<li>Reporting depth</li>
<li>Alerting support</li>
<li>Available integrations</li>
</ul>
<h3 class="anchor anchorWithStickyNavbar_FNw8" id="supported-metrics">Supported metrics<a href="https://www.debugbear.com/software/best-synthetic-monitoring-tools#supported-metrics" class="hash-link" aria-label="Direct link to Supported metrics" title="Direct link to Supported metrics">​</a></h3>
<p>When testing website performance it's important to measure modern user-centric metrics. That includes Google's Core Web Vitals, especially the <a href="https://www.debugbear.com/docs/metrics/largest-contentful-paint">Largest Contentful Paint</a> metric that measures page load time.</p>
<p><a href="https://www.debugbear.com/docs/metrics/cumulative-layout-shift">Cumulative Layout Shift</a>, another Core Web Vital, is also important to measure during the initial load of a website. It indicates whether content shifts around on the page after rendering. Visual instability is confusing to the user and can result in accidental clicks.</p>
<p><a href="https://www.debugbear.com/docs/metrics/time-to-first-byte">Time to First Byte</a> and <a href="https://www.debugbear.com/docs/metrics/first-contentful-paint">First Contentful Paint</a> are also important metrics for understanding your page speed.</p>
<p>Many synthetic monitoring tools go far beyond that, providing detailed metrics on page load milestones, <a href="https://www.debugbear.com/blog/page-weight-website-speed">page weight</a>, CPU processing, and on-page errors.</p>
<p>Monitoring <a href="https://www.debugbear.com/blog/lighthouse-page-speed">Lighthouse</a> scores is also a good practice, as it can quickly highlight regressions in the Performance, SEO, and Accessibility categories.</p>
<p>Finally, a few tools complement their synthetic metrics with real user Core Web Vitals data from the <a href="https://www.debugbear.com/blog/chrome-user-experience-report">Chrome User Experience Report</a> (CrUX). This tells you how fast your website is for actual visitors. CrUX data is also important for SEO, as Google uses it as a <a href="https://www.debugbear.com/docs/core-web-vitals-ranking-factor">ranking factor</a>.</p>
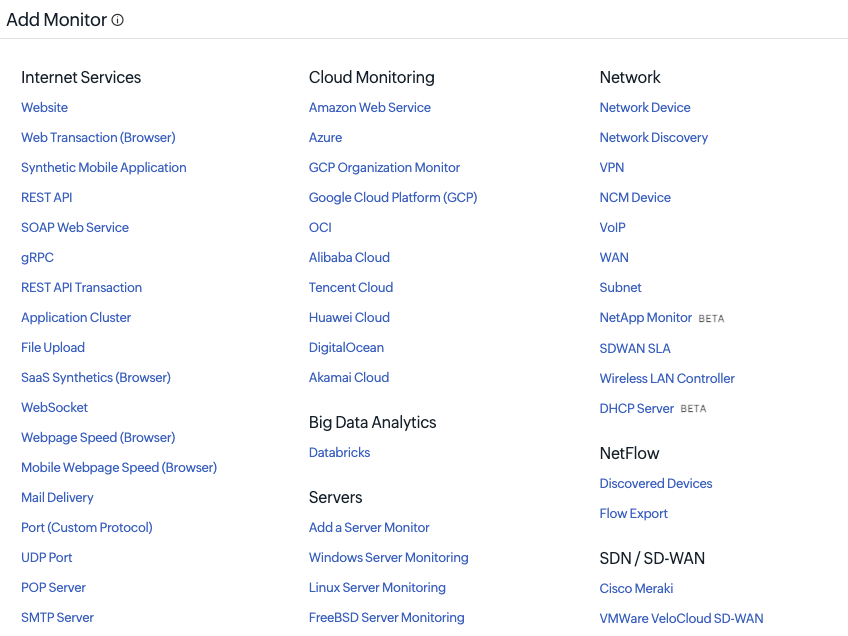
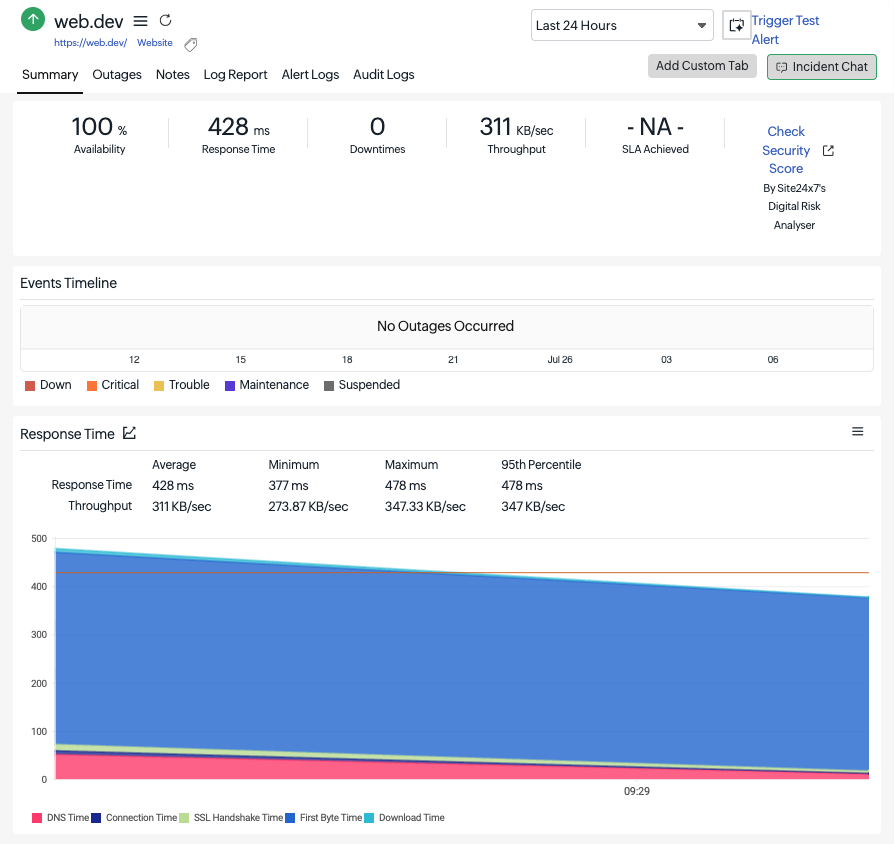
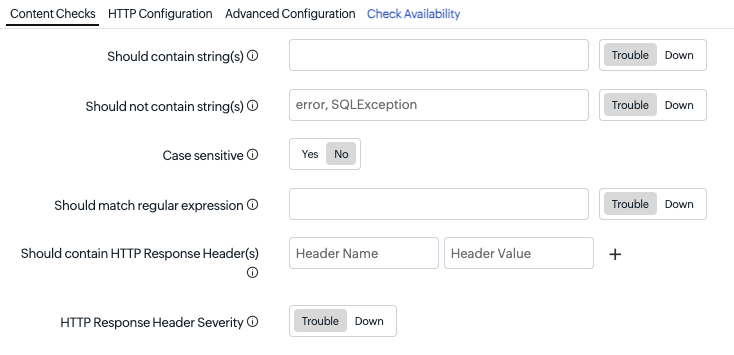
<p><img loading="lazy" src="https://www.debugbear.com/dimg/da30c881dfda567e62c50014d55f4ff0.png" alt="Google CrUX data" style="border-radius:4px" data-abc="true" class="img_CujE"></p>
<h3 class="anchor anchorWithStickyNavbar_FNw8" id="global-test-locations">Global test locations<a href="https://www.debugbear.com/software/best-synthetic-monitoring-tools#global-test-locations" class="hash-link" aria-label="Direct link to Global test locations" title="Direct link to Global test locations">​</a></h3>
<p>Another factor to check is whether the monitoring tool allows you to test your website from different locations across the globe. Website speed varies depending on where your website is accessed from, so testing from a location close to your visitors lets you make sure your website is fast enough for them.</p>
<p>The location doesn't have to match exactly –&nbsp;you won't see a big difference between a test run from France or Belgium&nbsp;–&nbsp;but should be reasonably close.</p>
<h3 class="anchor anchorWithStickyNavbar_FNw8" id="data-quality">Data quality<a href="https://www.debugbear.com/software/best-synthetic-monitoring-tools#data-quality" class="hash-link" aria-label="Direct link to Data quality" title="Direct link to Data quality">​</a></h3>
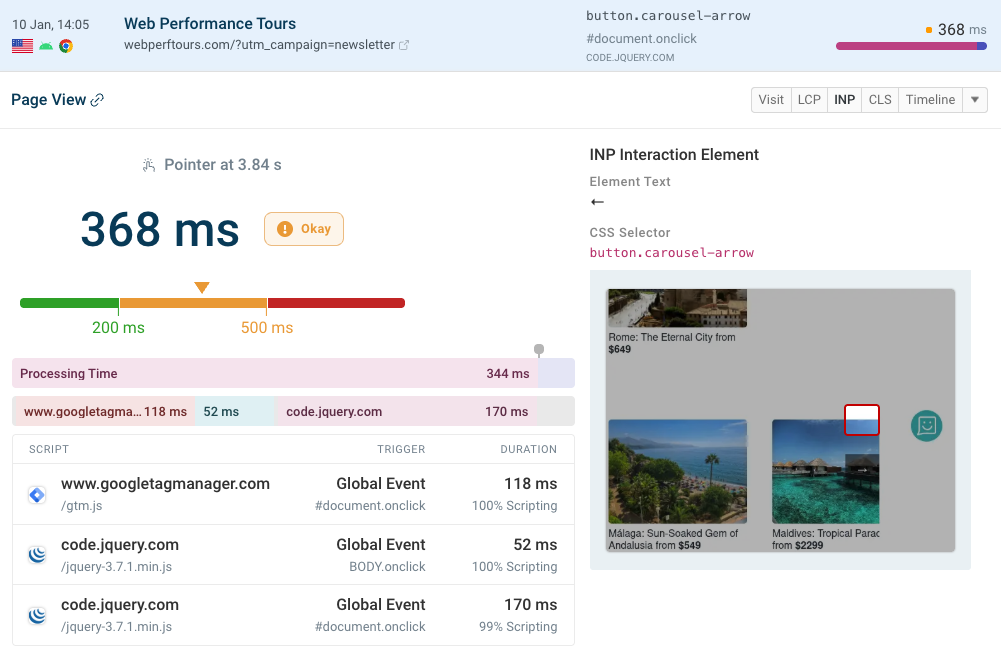
<p>Another question to consider is whether you can trust the reported data. One common issue with Lighthouse-based tools like <a href="https://www.debugbear.com/blog/pagespeed-insights">PageSpeed Insights</a> is that they <a href="https://www.debugbear.com/blog/is-pagespeed-insights-reliable">are unreliable</a>.</p>
<p>Check that the tool actually throttles the network when running a test, rather than collecting data on a fast connection before simulating a slow interaction. If a Lighthouse report is provided you can check the test settings to see whether the network data includes the word "Simulated".</p>
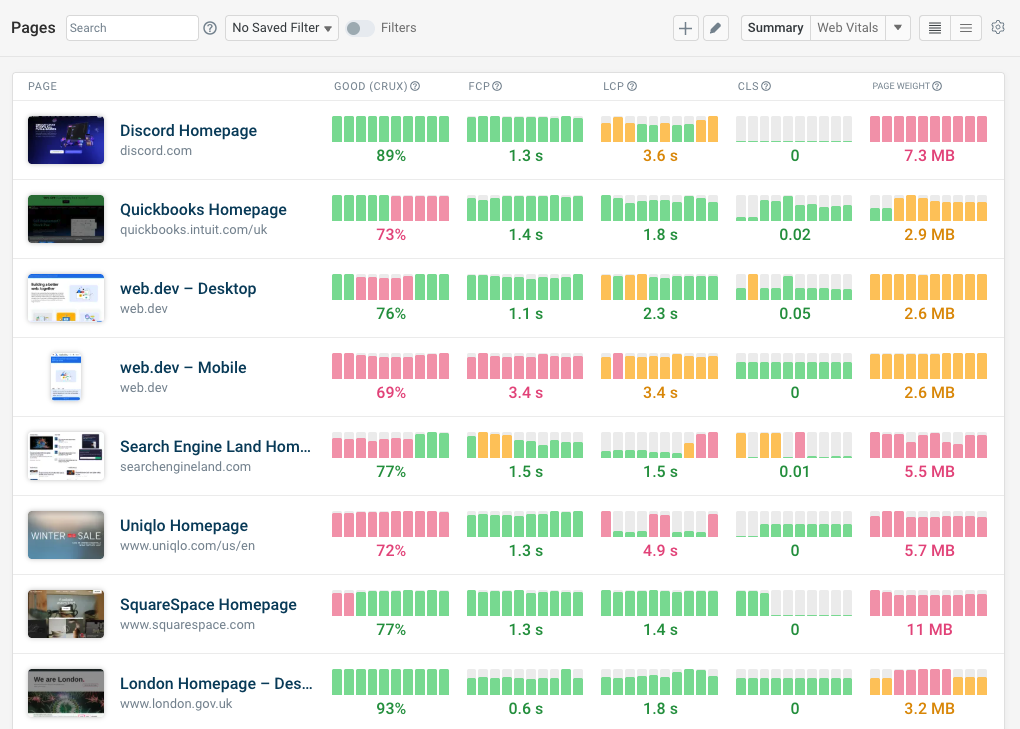
<p>Tools with simulated throttling usually don't provide <a href="https://www.debugbear.com/docs/waterfall">request waterfall</a>, so if you see one that's a good sign.</p>
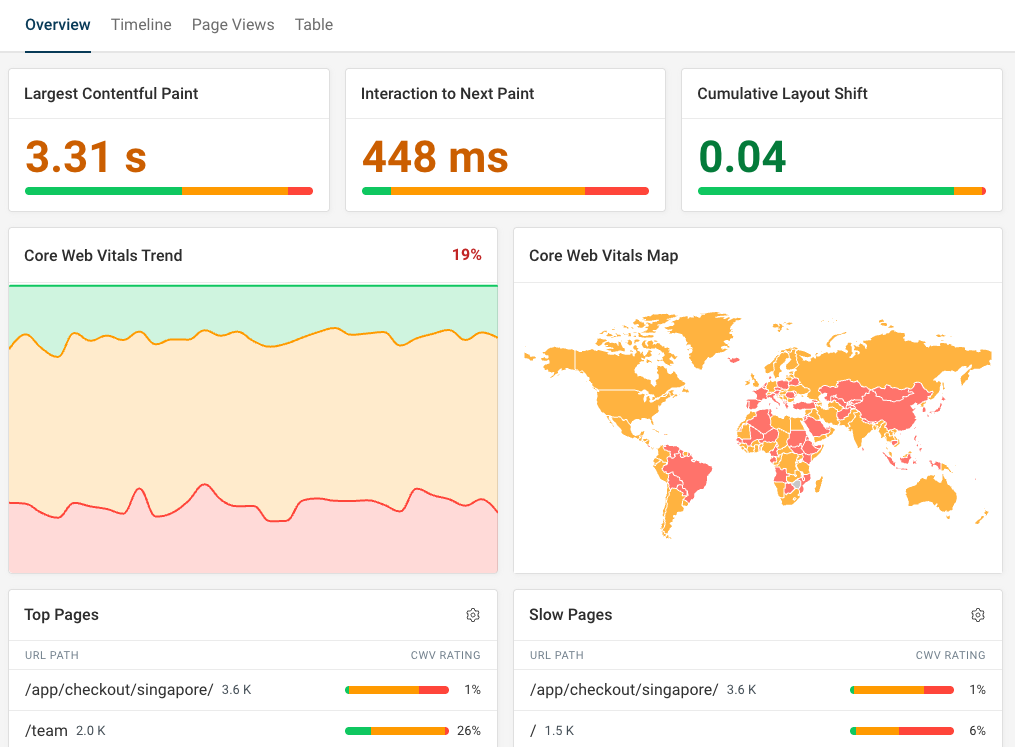
<p><img loading="lazy" src="https://www.debugbear.com/dimg/54a4e1c687ad5babf998a75c963dbe99.png" alt="Simulated data in Lighthouse" style="border-radius:4px" data-abc="true" class="img_CujE"></p>
<div class="theme-admonition theme-admonition-tip admonition_LMjb alert alert--success"><div class="admonitionHeading_GGQ4"><span class="admonitionIcon_ifdW"><svg viewBox="0 0 12 16"><path fill-rule="evenodd" d="M6.5 0C3.48 0 1 2.19 1 5c0 .92.55 2.25 1 3 1.34 2.25 1.78 2.78 2 4v1h5v-1c.22-1.22.66-1.75 2-4 .45-.75 1-2.08 1-3 0-2.81-2.48-5-5.5-5zm3.64 7.48c-.25.44-.47.8-.67 1.11-.86 1.41-1.25 2.06-1.45 3.23-.02.05-.02.11-.02.17H5c0-.06 0-.13-.02-.17-.2-1.17-.59-1.83-1.45-3.23-.2-.31-.42-.67-.67-1.11C2.44 6.78 2 5.65 2 5c0-2.2 2.02-4 4.5-4 1.22 0 2.36.42 3.22 1.19C10.55 2.94 11 3.94 11 5c0 .66-.44 1.78-.86 2.48zM4 14h5c-.23 1.14-1.3 2-2.5 2s-2.27-.86-2.5-2z"></path></svg></span>tip</div><div class="admonitionContent_pGk6"><p>Unreliable tools may give you a <a href="https://www.debugbear.com/blog/poor-performance-score-good-performance">poor performance score even when your website is fast</a>.</p></div></div>
<h3 class="anchor anchorWithStickyNavbar_FNw8" id="reporting-depth">Reporting depth<a href="https://www.debugbear.com/software/best-synthetic-monitoring-tools#reporting-depth" class="hash-link" aria-label="Direct link to Reporting depth" title="Direct link to Reporting depth">​</a></h3>
<p>Another challenge is how much data is available to investigate performance issues. Many tools just present data from Google's free Lighthouse report without providing additional detail.</p>
<p>Some things to look out for:</p>
<ul>
<li>Request waterfalls</li>
<li>Rendering video view</li>
<li>Custom recommendations</li>
<li>Comparisons across tests</li>
</ul>
<p>For example, DebugBear provides a lot of additional insight when inspecting a metric like the Largest Contentful Paint.</p>
<p><img loading="lazy" src="https://www.debugbear.com/dimg/289be8d85c0fbdfd98d8a397f92b334a.png" alt="LCP debug detail" style="border-radius:4px" data-abc="true" class="img_CujE"></p>
<p>You also get custom performance recommendations that go beyond Lighthouse audits. For example, you can identify and debug large CSS files, or avoid excessive font preloading.</p>
<p><img loading="lazy" src="https://www.debugbear.com/dimg/084528d1edd4f9634de1db2aa4c9b6cf.png" alt="DebugBear recommendations" style="border-radius:4px" data-abc="true" class="img_CujE"></p>
<h3 class="anchor anchorWithStickyNavbar_FNw8" id="alerting-support">Alerting support<a href="https://www.debugbear.com/software/best-synthetic-monitoring-tools#alerting-support" class="hash-link" aria-label="Direct link to Alerting support" title="Direct link to Alerting support">​</a></h3>
<p>A big benefit of having synthetic monitoring in place is that you'll get automated alerts when a new deployment, third-party change, or content update starts to impact your performance metrics.</p>
<p>Check that you can configure custom performance budgets to control alerts and configure what pages are included in alerts.</p>
<h3 class="anchor anchorWithStickyNavbar_FNw8" id="available-integrations">Available integrations<a href="https://www.debugbear.com/software/best-synthetic-monitoring-tools#available-integrations" class="hash-link" aria-label="Direct link to Available integrations" title="Direct link to Available integrations">​</a></h3>
<p>Integrations make it easy for your team to access performance data where you're already working. Whether that's Slack, Microsoft Teams, or GitHub, having page speed metrics quickly available and noticing alerts early helps you deliver a fast website.</p>
<h2 class="anchor anchorWithStickyNavbar_FNw8" id="what-are-the-limitations-of-synthetic-monitoring-tools">What are the limitations of synthetic monitoring tools?<a href="https://www.debugbear.com/software/best-synthetic-monitoring-tools#what-are-the-limitations-of-synthetic-monitoring-tools" class="hash-link" aria-label="Direct link to What are the limitations of synthetic monitoring tools?" title="Direct link to What are the limitations of synthetic monitoring tools?">​</a></h2>
<p>Synthetic tools are a great help when improving your website, but there are certain types of information you can't get from them:</p>
<ul>
<li><strong>Real user experience</strong>: lab tests don't tell you how fast your website is for your actual visitors. It may be that they tend to have particularly slow or fast connections, and you won't be able to know.</li>
<li><strong>User interactions</strong> on the website: a big part of how fast a website feels depends not on the initial load speed but on how quickly it responds to user input. While many tools allow you to script interactions, there's no guarantee that those interactions match what users most commonly do on the page.</li>
</ul>
<p>To address these issues you can use <a href="https://www.debugbear.com/real-user-monitoring">real user monitoring</a>. It will show you how performance varies across your visitor base and what a typical experience looks like. You can also use this data to debug issues with Google's <a href="https://www.debugbear.com/docs/metrics/interaction-to-next-paint">Interaction to Next Paint</a> (INP) metric.</p>
<p><img loading="lazy" src="https://www.debugbear.com/dimg/f8e13202d9e7f278be16a861d74a7fef.png" alt="INP dashboard in real user data" style="border-radius:4px" data-abc="true" class="img_CujE"></p>
<h2 class="anchor anchorWithStickyNavbar_FNw8" id="get-started-with-website-performance-monitoring">Get started with website performance monitoring<a href="https://www.debugbear.com/software/best-synthetic-monitoring-tools#get-started-with-website-performance-monitoring" class="hash-link" aria-label="Direct link to Get started with website performance monitoring" title="Direct link to Get started with website performance monitoring">​</a></h2>
<p>There are lots of <a href="https://www.debugbear.com/software/best-website-performance-monitoring-tools">website performance monitoring tools</a> out there. Most of them offer a free trial, so you can see how well they work for your use case.</p>
<p>Ready to get started? Sign up for <a href="https://www.debugbear.com/">DebugBear</a> to get a detailed analysis of your website and see how fast it performs in our controlled lab environment.</p>
<!-- -->
<div class="cta_Vy7l"><div class="ctaContainer_dzq8"><div class="ctaImage_MZ5b"><img src="https://www.debugbear.com/dimg/57001785e35454b95f43aa4f3bf6f857.png" alt="Illustration of website monitoring" class="themedComponent_mlkZ themedComponent--light_NVdE"><img src="https://www.debugbear.com/dimg/b2c0ae7a8dfbc4b18ba827a334c5c1af.png" alt="Illustration of website monitoring" class="themedComponent_mlkZ themedComponent--dark_xIcU"></div><div class="ctaContent_VgWi"><h2>Monitor Page Speed &amp; Core Web Vitals</h2><div class="ctaBenefits_OYw7"><h3>DebugBear monitoring includes:</h3><ul><li>In-depth Page Speed Reports</li><li>Automated Recommendations</li><li>Real User Analytics Data</li></ul></div><div><a href="https://www.debugbear.com/signup" class="ctaButton_Uos9 hidden-when-logged-in"><span>Start Free Trial</span></a><a href="https://www.debugbear.com/app" class="ctaButton_Uos9 visible-when-logged-in"><span>Go To App</span></a></div></div></div></div>]]></content>
        <author>
            <name>Umar Hansa</name>
            <uri>https://x.com/umaar</uri>
        </author>
    </entry>
    <entry>
        <title type="html"><![CDATA[Best SEO Testing And Monitoring Tools In 2026]]></title>
        <id>https://www.debugbear.com/software/best-seo-monitoring-tools</id>
        <link href="https://www.debugbear.com/software/best-seo-monitoring-tools"/>
        <updated>2026-01-17T00:00:00.000Z</updated>
        <summary type="html"><![CDATA[Discover the best SEO testing and monitoring tools to track rankings, optimize Core Web Vitals, and improve your website's search performance.]]></summary>
        <content type="html"><![CDATA[<p>SEO is a key driver of website traffic for many businesses. There are many services available to monitor ranking and optimization data to help you reach your audience, ranging from free SEO tools to comprehensive enterprise platforms.</p>
<p>In this article, we'll explore some of the best SEO testing and monitoring tools available in 2026.</p>
<h2 class="anchor anchorWithStickyNavbar_FNw8" id="1-ahrefs">1. Ahrefs<a href="https://www.debugbear.com/software/best-seo-monitoring-tools#1-ahrefs" class="hash-link" aria-label="Direct link to 1. Ahrefs" title="Direct link to 1. Ahrefs">​</a></h2>
<p><a href="https://ahrefs.com/" target="_blank" rel="noopener noreferrer">Ahrefs</a> is a comprehensive SEO platform that serves small businesses as well as enterprise customers.</p>
<p>For example, Ahrefs lets you:</p>
<ul>
<li>View keyword volume and track rankings over time</li>
<li>Identify new backlinks linking to your website</li>
<li>Detect <a href="https://www.debugbear.com/blog/technical-seo-checklist">technical SEO</a> issues on your pages</li>
<li>Track whether AI tools are mentioning your brand</li>
<li>Optimize your content to improve rankings</li>
</ul>
<p><img loading="lazy" src="https://www.debugbear.com/dimg/ee42dc8cb57fd8a3ce16825c443e4018.png" alt="Ahrefs site dashboard" style="border-radius:4px" data-abc="true" class="img_CujE"></p>
<p>Ahrefs can provide in-depth insights into keywords that drive traffic to your own website or those of your competitors. You can see not just what the top keywords are, but also how estimated traffic volume is changing over time.</p>
<p>For each keyword you can see:</p>
<ul>
<li>KD: A keyword difficulty score between 0 and 100 that indicates how hard it is to rank for the keyword</li>
<li>SF: What search features are shown for the keyword (for example AI overviews or video sections)</li>
<li>CPC: The average cost per click if you were to run ads for the keyword</li>
<li>GV: Global search volume</li>
<li>What websites are currently ranking for it</li>
</ul>
<p>This allows Ahrefs to provide in-depth insights into what information users are searching for and how to optimize your content to match that intent. Keep in mind that Ahrefs only provides estimated traffic volumes based on their own data sources, which may not always match actual traffic volume.</p>
<p><img loading="lazy" src="https://www.debugbear.com/dimg/2e8ba71ca6d1802ef5a1d3bc7facef3f.png" alt="Ahrefs keyword data" style="border-radius:4px" data-abc="true" class="img_CujE"></p>
<h2 class="anchor anchorWithStickyNavbar_FNw8" id="2-debugbear">2. DebugBear<a href="https://www.debugbear.com/software/best-seo-monitoring-tools#2-debugbear" class="hash-link" aria-label="Direct link to 2. DebugBear" title="Direct link to 2. DebugBear">​</a></h2>
<p><a href="https://www.debugbear.com/">DebugBear</a> is a website performance monitoring and testing tool with a focus on the <a href="https://www.debugbear.com/docs/metrics/core-web-vitals">Core Web Vitals</a> metrics that <a href="https://www.debugbear.com/docs/core-web-vitals-ranking-factor">impact Google rankings</a>.</p>
<p>Optimizing Core Web Vitals is also important for visitor experience once users have arrived on your website.</p>
<p>DebugBear provides comprehensive insights by combining three data sources:</p>
<ul>
<li><a href="https://www.debugbear.com/synthetic-website-monitoring"><strong>Synthetic monitoring</strong></a>: Scheduled tests that measure performance from different global locations. Get detailed performance reports and request waterfalls to identify optimizations.</li>
<li><a href="https://www.debugbear.com/real-user-monitoring"><strong>Real user monitoring</strong></a>: Track how actual visitors experience your website. Measure Core Web Vitals and other performance metrics across your whole site.</li>
<li><a href="https://www.debugbear.com/google-crux-monitoring"><strong>Chrome User Experience Report (CrUX)</strong></a>: Field data collected from real Chrome users that Google uses for SEO rankings. Monitor how your website performs in comparison to competitors.</li>
</ul>
<p><img loading="lazy" src="https://www.debugbear.com/dimg/6fc30dd1d88538ba9a47bf7cd4027256.png" alt="Real user monitoring dashboard with Core Web Vitals data for SEO analysis" style="border-radius:4px" data-abc="true" class="img_CujE"></p>
<p>The DebugBear web performance data provides both high-level user experience metrics as well as the detailed technical reports your team needs to implement optimizations.</p>
<p>For example, this screenshot shows page speed data over time as well as identifying specific render-blocking requests and how they impact page load progress.</p>
<p><img loading="lazy" src="https://www.debugbear.com/dimg/3e8389df305782282c4ed7d6734b8104.png" alt="Synthetic page speed test result" style="border-radius:4px" data-abc="true" class="img_CujE"></p>
<p>You can also track the SEO score from Google's free Lighthouse tool, which also powers PageSpeed Insights.</p>
<p>When there's a regression you can easily identify the specific audit where an issue was introduced and compare it to previous test results.</p>
<p><img loading="lazy" src="https://www.debugbear.com/dimg/a9ec8402405f3e8f4ebf749929d40911.png" alt="Lighthouse SEO monitoring" style="border-radius:4px" data-abc="true" class="img_CujE"></p>
<h2 class="anchor anchorWithStickyNavbar_FNw8" id="3-google-search-console">3. Google Search Console<a href="https://www.debugbear.com/software/best-seo-monitoring-tools#3-google-search-console" class="hash-link" aria-label="Direct link to 3. Google Search Console" title="Direct link to 3. Google Search Console">​</a></h2>
<p><a href="https://www.debugbear.com/software/google-search-console-guide">Google Search Console</a> (formerly known as Webmaster Tools) is a free tool provided by Google to help website owners monitor and optimize how their website shows up in Google search results.</p>
<p>While other SEO tools provide estimated search traffic data, Search Console reports actual data from Google. However, you can only see data for your own websites and not for competitors.</p>
<p>Search Console provides key metrics about your rankings:</p>
<ul>
<li>Total clicks: How many users clicked through to your website</li>
<li>Total impressions: How many times your website appeared in search results</li>
<li>Average CTR: The click-through rate, calculated as clicks divided by impressions</li>
<li>Average position: The average ranking position of your website for the selected keywords</li>
</ul>
<p><img loading="lazy" src="https://www.debugbear.com/dimg/c9d45cf683c9118b4e07c3aa25474bcc.png" alt="Search Console traffic overview" style="border-radius:4px" data-abc="true" class="img_CujE"></p>
<p>On top of ranking data, Search Console also includes reporting on technical SEO issues like sitemaps, Core Web Vitals, or enhancements like breadcrumbs or ecommerce schema markup.</p>
<p>More recently, Google also added a new Insights report that tells you which of your pages and keywords are getting more or less traffic. The report also makes it easy to see how your top content is performing.</p>
<p><img loading="lazy" src="https://www.debugbear.com/dimg/139ee58ccdd982c9d11d2bd27472e9cf.png" alt="Google Search Console insights report" style="border-radius:4px" data-abc="true" class="img_CujE"></p>
<h2 class="anchor anchorWithStickyNavbar_FNw8" id="4-seo-testing">4. SEO Testing<a href="https://www.debugbear.com/software/best-seo-monitoring-tools#4-seo-testing" class="hash-link" aria-label="Direct link to 4. SEO Testing" title="Direct link to 4. SEO Testing">​</a></h2>
<p><a href="https://seotesting.com/" target="_blank" rel="noopener noreferrer">SEO Testing</a> is a specialized SEO monitoring tool that focuses on tracking your search rankings over time. It's based on data from Google Search Console and Google Analytics.</p>
<p>The core feature of the product is the SEO Test: whenever you make a change on your website you can see how that impacts your rankings for specific pages and keywords.</p>
<p>All too often we update content without really measuring the impact or understanding whether it made things better or worse. SEO Testing provides a structured way to assess the impact of content optimizations.</p>
<p><img loading="lazy" src="https://www.debugbear.com/dimg/46c53e8e1a142508db35734063e55be0.png" alt="SEO Test screenshot" style="border-radius:4px" data-abc="true" class="img_CujE"></p>
<p>Other than testing the impact of website changes, SEO Testing also offers additional reporting based on your Search Console data. For example you can identify new keywords, keywords in striking distance to a good ranking, or potential low-quality content.</p>
<p>You can get notified of keyword, URL, or traffic changes through email alerts. Content groups allow you to segment search traffic data for different parts of your website.</p>
<p><img loading="lazy" src="https://www.debugbear.com/dimg/f52ce717a55b13ca3e637d81fb17974e.png" alt="SEO Testing keyword report" style="border-radius:4px" data-abc="true" class="img_CujE"></p>
<h2 class="anchor anchorWithStickyNavbar_FNw8" id="5-screaming-frog">5. Screaming Frog<a href="https://www.debugbear.com/software/best-seo-monitoring-tools#5-screaming-frog" class="hash-link" aria-label="Direct link to 5. Screaming Frog" title="Direct link to 5. Screaming Frog">​</a></h2>
<p><a href="https://www.screamingfrog.co.uk/" target="_blank" rel="noopener noreferrer">Screaming Frog</a> is a technical SEO tool that crawls your website to identify potential issues that could impact search rankings. You can run the tool directly on your own computer.</p>
<p>The product helps you identify potential <a href="https://www.debugbear.com/software/website-optimization-tools">website optimizations</a> like broken links, missing meta descriptions, duplicate content, or slow-loading pages.</p>
<p><img loading="lazy" src="https://www.debugbear.com/dimg/02bb2c7fcd124367dff682c049707716.png" alt="Screaming Frog spider result" style="border-radius:4px" data-abc="true" class="img_CujE"></p>
<p>On top of being a great SEO auditing tool, Screaming Frog also has a hilarious <a href="https://www.screamingfrog.co.uk/screaming-frog-alternatives/" target="_blank" rel="noopener noreferrer">"alternative to" page</a> comparing the screaming frog to other animals like the laughing hyena or the howler monkey!</p>
<p><img loading="lazy" src="https://www.debugbear.com/dimg/321aef553135be62b5c27af5b4b25efd.png" alt="Screaming Frog alternative page" style="border-radius:4px" data-abc="true" class="img_CujE"></p>
<h2 class="anchor anchorWithStickyNavbar_FNw8" id="6-website-seo-checker">6. Website SEO Checker<a href="https://www.debugbear.com/software/best-seo-monitoring-tools#6-website-seo-checker" class="hash-link" aria-label="Direct link to 6. Website SEO Checker" title="Direct link to 6. Website SEO Checker">​</a></h2>
<p>The <a href="https://www.debugbear.com/website-seo-checker" target="_blank" rel="noopener noreferrer">free website SEO checker</a> by DebugBear offers a quick way to check on-page SEO and meta data for any URL.</p>
<p><img loading="lazy" src="https://www.debugbear.com/dimg/440f4c6adf09f8248e7a9c3c9f2c010f.png" alt="SEO Checker landing page" style="border-radius:4px" data-abc="true" class="img_CujE"></p>
<p>The report includes a general SEO and crawlability assessment, validation checks for open graph data, as well as an analysis of heading structure and keywords.</p>
<p><img loading="lazy" src="https://www.debugbear.com/dimg/9f7ea1a7e5692a9ded0e321f6266d4cb.png" alt="SEO Audit result" style="border-radius:4px" data-abc="true" class="img_CujE"></p>
<h2 class="anchor anchorWithStickyNavbar_FNw8" id="7-lumar">7. Lumar<a href="https://www.debugbear.com/software/best-seo-monitoring-tools#7-lumar" class="hash-link" aria-label="Direct link to 7. Lumar" title="Direct link to 7. Lumar">​</a></h2>
<p>If you're looking for a dedicated enterprise SEO tool, <a href="https://www.lumar.io/" target="_blank" rel="noopener noreferrer">Lumar</a> (formerly known as DeepCrawl) provides a comprehensive platform for monitoring and optimizing large websites.</p>
<p>You can use it to monitor many technical aspects of website SEO, including indexability, page speed, content duplication, and keyword usage.</p>
<p><img loading="lazy" src="https://www.debugbear.com/dimg/f54debc153f551ce3ef017d18951256b.png" alt="Lumar dashboard" style="border-radius:4px" data-abc="true" class="img_CujE"></p>
<h2 class="anchor anchorWithStickyNavbar_FNw8" id="whats-the-best-seo-software">What's the best SEO software?<a href="https://www.debugbear.com/software/best-seo-monitoring-tools#whats-the-best-seo-software" class="hash-link" aria-label="Direct link to What's the best SEO software?" title="Direct link to What's the best SEO software?">​</a></h2>
<p>Depending on your needs, different tools will be best for you. In most cases you'll combine different platforms to gain the most comprehensive and nuanced insights.</p>
<p>Free SEO tools like Google Search Console or the Website SEO Checker are a great place to start for small businesses. For researching new keywords, Ahrefs provides in-depth data and competitive insights.</p>
<p>If you want to improve Core Web Vitals and visitor experience on your website you can use DebugBear to get alerted to performance regressions and to collect diagnostic data to <a href="https://www.debugbear.com/blog/improve-website-performance">optimize website performance</a>.</p>
<p>DebugBear also lets you benchmark your own website to those of your competitors, using real user data from Google. <a href="https://www.debugbear.com/signup">Sign up for a free trial today!</a></p>
<p><img loading="lazy" src="https://www.debugbear.com/dimg/3e15bd50969fd8da9ff4385e1536a4d7.png" alt="DebugBear website benchmark" style="border-radius:4px" data-abc="true" class="img_CujE"></p>
<!-- -->
<div class="cta_Vy7l"><div class="ctaContainer_dzq8"><div class="ctaImage_MZ5b"><img src="https://www.debugbear.com/dimg/57001785e35454b95f43aa4f3bf6f857.png" alt="Illustration of website monitoring" class="themedComponent_mlkZ themedComponent--light_NVdE"><img src="https://www.debugbear.com/dimg/b2c0ae7a8dfbc4b18ba827a334c5c1af.png" alt="Illustration of website monitoring" class="themedComponent_mlkZ themedComponent--dark_xIcU"></div><div class="ctaContent_VgWi"><h2>Monitor Page Speed &amp; Core Web Vitals</h2><div class="ctaBenefits_OYw7"><h3>DebugBear monitoring includes:</h3><ul><li>In-depth Page Speed Reports</li><li>Automated Recommendations</li><li>Real User Analytics Data</li></ul></div><div><a href="https://www.debugbear.com/signup" class="ctaButton_Uos9 hidden-when-logged-in"><span>Start Free Trial</span></a><a href="https://www.debugbear.com/app" class="ctaButton_Uos9 visible-when-logged-in"><span>Go To App</span></a></div></div></div></div>]]></content>
        <author>
            <name>Matt Zeunert</name>
        </author>
    </entry>
    <entry>
        <title type="html"><![CDATA[6 Best Splunk Alternatives In 2026]]></title>
        <id>https://www.debugbear.com/software/splunk-alternatives</id>
        <link href="https://www.debugbear.com/software/splunk-alternatives"/>
        <updated>2026-01-11T00:00:00.000Z</updated>
        <summary type="html"><![CDATA[Explore the best Splunk alternatives for website monitoring, observability, and performance testing in 2026.]]></summary>
        <content type="html"><![CDATA[<p>Splunk is a platform that provides observability into website infrastructure and performance. If you're looking for an alternative, you can either pick a more specialized tool or evaluate another comprehensive monitoring platform.</p>
<p>In this article, we'll explore different alternatives to Splunk and what their respective strengths are.</p>
<h2 class="anchor anchorWithStickyNavbar_FNw8" id="1-debugbear">1. DebugBear<a href="https://www.debugbear.com/software/splunk-alternatives#1-debugbear" class="hash-link" aria-label="Direct link to 1. DebugBear" title="Direct link to 1. DebugBear">​</a></h2>
<p>If you're focused on website performance, <a href="https://www.debugbear.com/">DebugBear</a> is a specialized alternative to Splunk. It provides both synthetic monitoring and real user monitoring to help you track and improve your website speed.</p>
<p>For example, you can run scheduled synthetic tests from different global locations and get detailed performance reports to help you identify optimizations. Set up alerts to get notified when there's a performance regression.</p>
<p><img loading="lazy" src="https://www.debugbear.com/dimg/6858e7f9d07e7448918383093fd4e73b.png" alt="DebugBear synthetic monitoring dashboard" style="border-radius:4px" data-abc="true" class="img_CujE"></p>
<p>The request waterfall view tells you when different resources are loaded and how that impacts rendering and user experience.</p>
<p>DebugBear highlights the priority of each request and tells you which resources block rendering, are preloaded, or loaded asynchronously.</p>
<p><img loading="lazy" src="https://www.debugbear.com/dimg/bf4367156bfdce10164b04c76992ae9f.png" alt="Request waterfall view" style="border-radius:4px" data-abc="true" class="img_CujE"></p>
<p>The platform also includes <a href="https://www.debugbear.com/real-user-monitoring">real user monitoring</a> to track how actual visitors experience your website. You can measure Core Web Vitals and other performance metrics across your whole site.</p>
<p>You can also identify what's slowing down your website, whether that's specific scripts that delay interactions or large images that increase load time.</p>
<p><img loading="lazy" src="https://www.debugbear.com/dimg/7199f2a283d32055ca91bb6be97c5dbc.png" alt="Real user monitoring dashboard" style="border-radius:4px" data-abc="true" class="img_CujE"></p>
<p>On top of tracking synthetic and real user data, DebugBear also keeps track of the Google Chrome User Experience Report data that <a href="https://www.debugbear.com/docs/page-speed-seo">impacts SEO</a>.</p>
<h2 class="anchor anchorWithStickyNavbar_FNw8" id="2-dynatrace">2. Dynatrace<a href="https://www.debugbear.com/software/splunk-alternatives#2-dynatrace" class="hash-link" aria-label="Direct link to 2. Dynatrace" title="Direct link to 2. Dynatrace">​</a></h2>
<p>Dynatrace is another comprehensive observability platform that includes <a href="https://www.debugbear.com/software/dynatrace-synthetic-monitoring">synthetic monitoring</a> and <a href="https://www.debugbear.com/software/dynatrace-real-user-monitoring">real user monitoring</a> features. It also provides backend and infrastructure monitoring capabilities.</p>
<p>The synthetic monitoring product supports different types of tests like browser monitoring and HTTP checks. You can test from many different locations and customize cookies, headers, and browser configuration options.</p>
<p><img loading="lazy" src="https://www.debugbear.com/dimg/5050b7d589b1ddae49a9647c217b739b.png" alt="Dynatrace synthetic setup screen" style="border-radius:4px" data-abc="true" class="img_CujE"></p>
<p>The RUM product can track performance metrics, network requests, and <a href="https://www.debugbear.com/docs/rum/error-monitoring">JavaScript errors</a>.</p>
<p>Dynatrace provides insight on the three Google Core Web Vitals metrics and provides a detailed request waterfall for page speed analysis.</p>
<p><img loading="lazy" src="https://www.debugbear.com/dimg/66888bad0ac896e79baf0ac28c44dd23.png" alt="Dynatrace error reports" style="border-radius:4px" data-abc="true" class="img_CujE"></p>
<h2 class="anchor anchorWithStickyNavbar_FNw8" id="3-datadog">3. Datadog<a href="https://www.debugbear.com/software/splunk-alternatives#3-datadog" class="hash-link" aria-label="Direct link to 3. Datadog" title="Direct link to 3. Datadog">​</a></h2>
<p>Datadog is a modern observability tool covering everything from infrastructure monitoring, log analysis, and <a href="https://www.debugbear.com/software/digital-experience-monitoring">digital experience monitoring</a>.</p>
<p>The product lets you run synthetic tests and collect real user experience data. You can create complex custom dashboards and set up alerts to get alerted to website performance or availability issues.</p>
<p><img loading="lazy" src="https://www.debugbear.com/dimg/31b1aaa7427b627d6cd07988f0d67fd5.png" alt="DataDog dashboard" style="border-radius:4px" data-abc="true" class="img_CujE"></p>
<h2 class="anchor anchorWithStickyNavbar_FNw8" id="4-signoz">4. Signoz<a href="https://www.debugbear.com/software/splunk-alternatives#4-signoz" class="hash-link" aria-label="Direct link to 4. Signoz" title="Direct link to 4. Signoz">​</a></h2>
<p>Signoz presents itself as an open-source alternative to DataDog. It's based on OpenTelemetry and helps you collect logs, traces, and custom metrics.</p>
<p>The platform provides a lot of flexibility in how you collect data and create reports. It is not optimized for any specific use case like user experience monitoring or infrastructure analysis.</p>
<p>However, you can easily create custom dashboards and set up alerts at an affordable price.</p>
<p><img loading="lazy" src="https://www.debugbear.com/dimg/39a51f4b140b01cadec5638da7d6ea81.png" alt="Signoz dashboard" style="border-radius:4px" data-abc="true" class="img_CujE"></p>
<h2 class="anchor anchorWithStickyNavbar_FNw8" id="5-uptrends">5. Uptrends<a href="https://www.debugbear.com/software/splunk-alternatives#5-uptrends" class="hash-link" aria-label="Direct link to 5. Uptrends" title="Direct link to 5. Uptrends">​</a></h2>
<p><a href="https://www.debugbear.com/software/uptrends-website-speed-test">Uptrends</a> is a website monitoring and page speed testing tool by ITRS. For example, you can track uptime and publish status pages to keep your customers informed.</p>
<p>The platform also includes other digital experience monitoring features like synthetic monitoring and real user analytics.</p>
<p><img loading="lazy" src="https://www.debugbear.com/dimg/98489d307f4bfeca056cf297e71bfe89.png" alt="Uptrends screenshot" style="border-radius:4px" data-abc="true" class="img_CujE"></p>
<h2 class="anchor anchorWithStickyNavbar_FNw8" id="6-pingdom">6. Pingdom<a href="https://www.debugbear.com/software/splunk-alternatives#6-pingdom" class="hash-link" aria-label="Direct link to 6. Pingdom" title="Direct link to 6. Pingdom">​</a></h2>
<p><a href="https://www.debugbear.com/software/pingdom-speed-test">Pingdom</a> is a website monitoring platform that can report on website uptime and performance. You can also monitor backend infrastructure and manage server logs.</p>
<p>The real user monitoring product keeps track of each page view on your website and provides insight into page speed and user experience.</p>
<p><img loading="lazy" src="https://www.debugbear.com/dimg/10f310940dde4d429a223140de4054a5.png" alt="Pingdom dashboard screenshot" style="border-radius:4px" data-abc="true" class="img_CujE"></p>
<h2 class="anchor anchorWithStickyNavbar_FNw8" id="whats-the-best-alternative-to-splunk">What's the best alternative to Splunk?<a href="https://www.debugbear.com/software/splunk-alternatives#whats-the-best-alternative-to-splunk" class="hash-link" aria-label="Direct link to What's the best alternative to Splunk?" title="Direct link to What's the best alternative to Splunk?">​</a></h2>
<p>Depending on your needs, different Splunk alternatives will be the best fit for you:</p>
<ul>
<li>If you focus on web performance and user experience, DebugBear provides detailed insights</li>
<li>For full-service observability, use DataDog or Dynatrace</li>
<li>Signoz provides a lot of flexibility at low cost</li>
</ul>
<!-- -->
<div class="cta_Vy7l"><div class="ctaContainer_dzq8"><div class="ctaImage_MZ5b"><img src="https://www.debugbear.com/dimg/57001785e35454b95f43aa4f3bf6f857.png" alt="Illustration of website monitoring" class="themedComponent_mlkZ themedComponent--light_NVdE"><img src="https://www.debugbear.com/dimg/b2c0ae7a8dfbc4b18ba827a334c5c1af.png" alt="Illustration of website monitoring" class="themedComponent_mlkZ themedComponent--dark_xIcU"></div><div class="ctaContent_VgWi"><h2>Monitor Page Speed &amp; Core Web Vitals</h2><div class="ctaBenefits_OYw7"><h3>DebugBear monitoring includes:</h3><ul><li>In-depth Page Speed Reports</li><li>Automated Recommendations</li><li>Real User Analytics Data</li></ul></div><div><a href="https://www.debugbear.com/signup" class="ctaButton_Uos9 hidden-when-logged-in"><span>Start Free Trial</span></a><a href="https://www.debugbear.com/app" class="ctaButton_Uos9 visible-when-logged-in"><span>Go To App</span></a></div></div></div></div>]]></content>
        <author>
            <name>Matt Zeunert</name>
        </author>
    </entry>
    <entry>
        <title type="html"><![CDATA[How To Set Up Splunk Real User Monitoring]]></title>
        <id>https://www.debugbear.com/software/splunk-real-user-monitoring</id>
        <link href="https://www.debugbear.com/software/splunk-real-user-monitoring"/>
        <updated>2026-01-10T00:00:00.000Z</updated>
        <summary type="html"><![CDATA[Learn how to set up Splunk Real User Monitoring to track Core Web Vitals and optimize website performance for actual visitors.]]></summary>
        <content type="html"><![CDATA[<p>Real user monitoring can help you <a href="https://www.debugbear.com/blog/improve-website-performance">optimize your website performance</a> and improve user experience.</p>
<p>In this article, we'll explain how to set up RUM on Splunk and view Core Web Vitals data for your website.</p>
<h2 class="anchor anchorWithStickyNavbar_FNw8" id="what-is-splunk-rum">What is Splunk RUM?<a href="https://www.debugbear.com/software/splunk-real-user-monitoring#what-is-splunk-rum" class="hash-link" aria-label="Direct link to What is Splunk RUM?" title="Direct link to What is Splunk RUM?">​</a></h2>
<p>The <a href="https://www.debugbear.com/docs/what-is-real-user-monitoring">real user monitoring</a> feature in the Splunk Observability Cloud can tell you how actual visitors experience your website. You also get technical insights to understand and improve user experience.</p>
<p>While real user data does not have the same depth as <a href="https://www.debugbear.com/docs/synthetic-website-monitoring">synthetic data</a>, it instead shows a distribution of real-world performance scores that tells you how well you're doing in practice.</p>
<h2 class="anchor anchorWithStickyNavbar_FNw8" id="how-to-set-up-real-user-monitoring-in-splunk">How to set up real user monitoring in Splunk<a href="https://www.debugbear.com/software/splunk-real-user-monitoring#how-to-set-up-real-user-monitoring-in-splunk" class="hash-link" aria-label="Direct link to How to set up real user monitoring in Splunk" title="Direct link to How to set up real user monitoring in Splunk">​</a></h2>
<p>To set up Splunk RUM you need to create a RUM access token, generate a new RUM configuration, and install a script on your website.</p>
<h3 class="anchor anchorWithStickyNavbar_FNw8" id="create-a-rum-access-token">Create a RUM access token<a href="https://www.debugbear.com/software/splunk-real-user-monitoring#create-a-rum-access-token" class="hash-link" aria-label="Direct link to Create a RUM access token" title="Direct link to Create a RUM access token">​</a></h3>
<p>The RUM access token allows your website to report monitoring data to Splunk.</p>
<p>To create a token:</p>
<ol>
<li>Open "Settings" in the left sidebar</li>
<li>Select "Access Tokens"</li>
<li>Click "Create Token"</li>
</ol>
<p><img loading="lazy" src="https://www.debugbear.com/dimg/5c631da0cc53a006d8675de13f179e79.png" alt="Creating a RUM access token" style="border-radius:4px" data-abc="true" class="img_CujE"></p>
<p>You can create different types of tokens, for example to use the Splunk API or report backend performance data. Here we want to create a "RUM Token".</p>
<p><img loading="lazy" src="https://www.debugbear.com/dimg/fd8f33cef37599de9ba0bface97f87ac.png" alt="Access token type and name dialog" style="border-radius:4px" data-abc="true" class="img_CujE"></p>
<p>Complete the process by specifying a name, permissions, and an expiration date.</p>
<h3 class="anchor anchorWithStickyNavbar_FNw8" id="create-a-rum-configuration">Create a RUM configuration<a href="https://www.debugbear.com/software/splunk-real-user-monitoring#create-a-rum-configuration" class="hash-link" aria-label="Direct link to Create a RUM configuration" title="Direct link to Create a RUM configuration">​</a></h3>
<p>Once you've created the RUM token you can use it to start collecting RUM data:</p>
<ol>
<li>Select "Digital Experience" in the left sidebar</li>
<li>Select "Real User Monitoring"</li>
<li>Open the overview page</li>
<li>Expand the "RUM Configuration" dropdown in the top right</li>
<li>Select "Create RUM Integration"</li>
</ol>
<p><img loading="lazy" src="https://www.debugbear.com/dimg/214dae0741f14ed422c2b7ae4799d083.png" alt="RUM configuration dropdown" style="border-radius:4px" data-abc="true" class="img_CujE"></p>
<p>Splunk can monitor real user monitoring on websites in the browser or on mobile iOS or Android apps.</p>
<p>We'll select the "Browser instrumentation" option.</p>
<p><img loading="lazy" src="https://www.debugbear.com/dimg/18ab2acda4abee82e61518a69a9bd98d.png" alt="Splunk RUM type" style="border-radius:4px" data-abc="true" class="img_CujE"></p>
<p>As the first step, Splunk explains how you can configure RUM for your front-end application. Splunk supports collecting OpenTelemetry data for your website, in addition to automatically measuring performance.</p>
<p>Click "Next" to continue. Then select the RUM token you created earlier.</p>
<p><img loading="lazy" src="https://www.debugbear.com/dimg/a980e091928c63a0b909be39cc798990.png" alt="Selecting the RUM token in Splunk" style="border-radius:4px" data-abc="true" class="img_CujE"></p>
<p>In the third step you need to specify the name of your website or application.</p>
<p>You can also specify an environment name to differentiate data collected on production or from a staging environment.</p>
<p><img loading="lazy" src="https://www.debugbear.com/dimg/34a01371e7e5a500cf2f0b149cd24bc2.png" alt="Configuring the RUM integration" style="border-radius:4px" data-abc="true" class="img_CujE"></p>
<p>Finally, Splunk provides the code that you need to install on your website. Preferably add the code to your HTML, or alternatively load it through a tag manager.</p>
<div class="theme-admonition theme-admonition-info admonition_LMjb alert alert--info"><div class="admonitionHeading_GGQ4"><span class="admonitionIcon_ifdW"><svg viewBox="0 0 14 16"><path fill-rule="evenodd" d="M7 2.3c3.14 0 5.7 2.56 5.7 5.7s-2.56 5.7-5.7 5.7A5.71 5.71 0 0 1 1.3 8c0-3.14 2.56-5.7 5.7-5.7zM7 1C3.14 1 0 4.14 0 8s3.14 7 7 7 7-3.14 7-7-3.14-7-7-7zm1 3H6v5h2V4zm0 6H6v2h2v-2z"></path></svg></span>info</div><div class="admonitionContent_pGk6"><p>Make sure to replace <code>&lt;version&gt;</code> with a specific version number like <code>v1.2.0</code> or <code>latest</code>.</p></div></div>
<p><img loading="lazy" src="https://www.debugbear.com/dimg/704136c31b0fc4739c1c9d2a011ca040.png" alt="Installing the Splunk RUM snippet" style="border-radius:4px" data-abc="true" class="img_CujE"></p>
<p>The code you install will look like this:</p>
<pre tabindex="0" class="codeBlockStandalone_Nhx8 thin-scrollbar codeBlockContainer_aalF theme-code-block" style="--prism-color:#bfc7d5;--prism-background-color:#292d3e"><code class="codeBlockLines_RjmQ"><div class="language-html codeBlockContainer_aalF theme-code-block" style="--prism-color:#bfc7d5;--prism-background-color:#292d3e"><div class="codeBlockContent_MHx8"><pre tabindex="0" class="prism-code language-html codeBlock_zHgq thin-scrollbar" style="color:#bfc7d5;background-color:#292d3e"><code class="codeBlockLines_RjmQ"><span class="token-line" style="color:#bfc7d5"><span class="token tag punctuation" style="color:rgb(199, 146, 234)">&lt;</span><span class="token tag" style="color:rgb(255, 85, 114)">script</span><span class="token tag" style="color:rgb(255, 85, 114)"></span><br></span><span class="token-line" style="color:#bfc7d5"><span class="token tag" style="color:rgb(255, 85, 114)">  </span><span class="token tag attr-name" style="color:rgb(255, 203, 107)">src</span><span class="token tag attr-value punctuation attr-equals" style="color:rgb(199, 146, 234)">=</span><span class="token tag attr-value punctuation" style="color:rgb(199, 146, 234)">"</span><span class="token tag attr-value" style="color:rgb(255, 85, 114)">https://cdn.signalfx.com/o11y-gdi-rum/v1.2.0/splunk-otel-web.js</span><span class="token tag attr-value punctuation" style="color:rgb(199, 146, 234)">"</span><span class="token tag" style="color:rgb(255, 85, 114)"></span><br></span><span class="token-line" style="color:#bfc7d5"><span class="token tag" style="color:rgb(255, 85, 114)">  </span><span class="token tag attr-name" style="color:rgb(255, 203, 107)">crossorigin</span><span class="token tag attr-value punctuation attr-equals" style="color:rgb(199, 146, 234)">=</span><span class="token tag attr-value punctuation" style="color:rgb(199, 146, 234)">"</span><span class="token tag attr-value" style="color:rgb(255, 85, 114)">anonymous</span><span class="token tag attr-value punctuation" style="color:rgb(199, 146, 234)">"</span><span class="token tag" style="color:rgb(255, 85, 114)"></span><br></span><span class="token-line" style="color:#bfc7d5"><span class="token tag" style="color:rgb(255, 85, 114)"></span><span class="token tag punctuation" style="color:rgb(199, 146, 234)">&gt;</span><span class="token script"></span><span class="token tag punctuation" style="color:rgb(199, 146, 234)">&lt;/</span><span class="token tag" style="color:rgb(255, 85, 114)">script</span><span class="token tag punctuation" style="color:rgb(199, 146, 234)">&gt;</span><span class="token plain"></span><br></span><span class="token-line" style="color:#bfc7d5"><span class="token plain"></span><span class="token tag punctuation" style="color:rgb(199, 146, 234)">&lt;</span><span class="token tag" style="color:rgb(255, 85, 114)">script</span><span class="token tag punctuation" style="color:rgb(199, 146, 234)">&gt;</span><span class="token script language-javascript"></span><br></span><span class="token-line" style="color:#bfc7d5"><span class="token script language-javascript">  </span><span class="token script language-javascript maybe-class-name">SplunkRum</span><span class="token script language-javascript punctuation" style="color:rgb(199, 146, 234)">.</span><span class="token script language-javascript method function property-access" style="color:rgb(130, 170, 255)">init</span><span class="token script language-javascript punctuation" style="color:rgb(199, 146, 234)">(</span><span class="token script language-javascript punctuation" style="color:rgb(199, 146, 234)">{</span><span class="token script language-javascript"></span><br></span><span class="token-line" style="color:#bfc7d5"><span class="token script language-javascript">    </span><span class="token script language-javascript literal-property property">realm</span><span class="token script language-javascript operator" style="color:rgb(137, 221, 255)">:</span><span class="token script language-javascript"> </span><span class="token script language-javascript string" style="color:rgb(195, 232, 141)">"eu2"</span><span class="token script language-javascript punctuation" style="color:rgb(199, 146, 234)">,</span><span class="token script language-javascript"></span><br></span><span class="token-line" style="color:#bfc7d5"><span class="token script language-javascript">    </span><span class="token script language-javascript literal-property property">rumAccessToken</span><span class="token script language-javascript operator" style="color:rgb(137, 221, 255)">:</span><span class="token script language-javascript"> </span><span class="token script language-javascript string" style="color:rgb(195, 232, 141)">"TOKEN_VALUE"</span><span class="token script language-javascript punctuation" style="color:rgb(199, 146, 234)">,</span><span class="token script language-javascript"></span><br></span><span class="token-line" style="color:#bfc7d5"><span class="token script language-javascript">    </span><span class="token script language-javascript literal-property property">applicationName</span><span class="token script language-javascript operator" style="color:rgb(137, 221, 255)">:</span><span class="token script language-javascript"> </span><span class="token script language-javascript string" style="color:rgb(195, 232, 141)">"NAME"</span><span class="token script language-javascript punctuation" style="color:rgb(199, 146, 234)">,</span><span class="token script language-javascript"></span><br></span><span class="token-line" style="color:#bfc7d5"><span class="token script language-javascript">    </span><span class="token script language-javascript literal-property property">deploymentEnvironment</span><span class="token script language-javascript operator" style="color:rgb(137, 221, 255)">:</span><span class="token script language-javascript"> </span><span class="token script language-javascript string" style="color:rgb(195, 232, 141)">"ENVIRONMENT"</span><span class="token script language-javascript punctuation" style="color:rgb(199, 146, 234)">,</span><span class="token script language-javascript"></span><br></span><span class="token-line" style="color:#bfc7d5"><span class="token script language-javascript">  </span><span class="token script language-javascript punctuation" style="color:rgb(199, 146, 234)">}</span><span class="token script language-javascript punctuation" style="color:rgb(199, 146, 234)">)</span><span class="token script language-javascript punctuation" style="color:rgb(199, 146, 234)">;</span><span class="token script language-javascript"></span><br></span><span class="token-line" style="color:#bfc7d5"><span class="token script language-javascript"></span><span class="token tag punctuation" style="color:rgb(199, 146, 234)">&lt;/</span><span class="token tag" style="color:rgb(255, 85, 114)">script</span><span class="token tag punctuation" style="color:rgb(199, 146, 234)">&gt;</span><br></span></code></pre><div class="buttonGroup_Sd8_"><button type="button" aria-label="Copy code to clipboard" title="Copy" class="clean-btn"><span class="copyButtonIcons_LnQD" aria-hidden="true"><svg viewBox="0 0 24 24" class="copyButtonIcon_t3l1"><path fill="currentColor" d="M19,21H8V7H19M19,5H8A2,2 0 0,0 6,7V21A2,2 0 0,0 8,23H19A2,2 0 0,0 21,21V7A2,2 0 0,0 19,5M16,1H4A2,2 0 0,0 2,3V17H4V3H16V1Z"></path></svg><svg viewBox="0 0 24 24" class="copyButtonSuccessIcon_IiZV"><path fill="currentColor" d="M21,7L9,19L3.5,13.5L4.91,12.09L9,16.17L19.59,5.59L21,7Z"></path></svg></span></button></div></div></div></code></pre>
<p>Splunk is now ready to collect RUM data. As the last step you can also configure source maps to get more readable JavaScript stack traces.</p>
<p>You can now view data in the RUM overview dashboard. For example, you can see how many page views have been recorded and what JavaScript errors occurred.</p>
<p><img loading="lazy" src="https://www.debugbear.com/dimg/672bb70e4c8ea498c59499a89f2ca220.png" alt="Splunk RUM dashboard" style="border-radius:4px" data-abc="true" class="img_CujE"></p>
<h2 class="anchor anchorWithStickyNavbar_FNw8" id="inspect-core-web-vitals-with-splunk-rum">Inspect Core Web Vitals with Splunk RUM<a href="https://www.debugbear.com/software/splunk-real-user-monitoring#inspect-core-web-vitals-with-splunk-rum" class="hash-link" aria-label="Direct link to Inspect Core Web Vitals with Splunk RUM" title="Direct link to Inspect Core Web Vitals with Splunk RUM">​</a></h2>
<p>Google's three Core Web Vitals metrics are also automatically collected by Splunk. You can see the <a href="https://www.debugbear.com/docs/rum/percentiles">75th percentile</a> score for LCP, INP, and CLS.</p>
<p><img loading="lazy" src="https://www.debugbear.com/dimg/1d85d9f2e07b55f0b1920cac7575a649.png" alt="Splunk RUM web vitals" style="border-radius:4px" data-abc="true" class="img_CujE"></p>
<p>You can click on each of the web vitals metrics to view additional breakdown data. For example, you can filter data for specific countries or browsers.</p>
<p>The histogram provides more detail on how visitor experiences are distributed on your website.</p>
<p><img loading="lazy" src="https://www.debugbear.com/dimg/d36111946527f7c5b014483328f025f0.png" alt="Core Web Vitals histogram" style="border-radius:4px" data-abc="true" class="img_CujE"></p>
<p>The breakdown tables also tell you more about how visitor experience varies across your website.</p>
<p>You can also view other percentiles like the p50 or p99 scores. This provides insight into both a typical user experience as well as the experience of your slowest visitors.</p>
<p><img loading="lazy" src="https://www.debugbear.com/dimg/a5c752141cc23742f1b1740af96c2762.png" alt="RUM data table view" style="border-radius:4px" data-abc="true" class="img_CujE"></p>
<h2 class="anchor anchorWithStickyNavbar_FNw8" id="view-user-sessions">View user sessions<a href="https://www.debugbear.com/software/splunk-real-user-monitoring#view-user-sessions" class="hash-link" aria-label="Direct link to View user sessions" title="Direct link to View user sessions">​</a></h2>
<p>The User sessions view provides more detail on specific visits to your website.</p>
<p>You can view per-page performance metrics, investigate slow network requests, review long CPU tasks, and observe user interactions on the page.</p>
<p><img loading="lazy" src="https://www.debugbear.com/dimg/6828215780b5aa4cb92bc3e6aa758ac2.png" alt="Splunk RUM page view" style="border-radius:4px" data-abc="true" class="img_CujE"></p>
<h2 class="anchor anchorWithStickyNavbar_FNw8" id="get-more-detailed-rum-core-web-vitals-data">Get more detailed RUM Core Web Vitals data<a href="https://www.debugbear.com/software/splunk-real-user-monitoring#get-more-detailed-rum-core-web-vitals-data" class="hash-link" aria-label="Direct link to Get more detailed RUM Core Web Vitals data" title="Direct link to Get more detailed RUM Core Web Vitals data">​</a></h2>
<p>Splunk RUM provides comprehensive page analytics. However, it's not optimized for helping you improve visitor experience and Core Web Vitals. For example, you can't easily see what the page LCP element was or what scripts caused a slow interaction.</p>
<p><a href="https://www.debugbear.com/real-user-monitoring">DebugBear RUM</a> is built to make web performance optimization easier. For example, you can easily inspect poor INP scores to identify what the user interacted with and what scripts ran in response to the user input.</p>
<p><img loading="lazy" src="https://www.debugbear.com/dimg/73f5303240c040dea5c67afde0f20f6d.png" alt="DebugBear INP debug data" style="border-radius:4px" data-abc="true" class="img_CujE"></p>
<p>You can also track higher-level metrics for different pages on your website and configure custom alerts to get notified of performance regressions.</p>
<p><a href="https://www.debugbear.com/signup">Sign up for a free trial.</a></p>
<p><img loading="lazy" src="https://www.debugbear.com/dimg/3b24490817f1e4095bbb63711938eecc.png" alt="DebugBear RUM web vitals dashboard" style="border-radius:4px" data-abc="true" class="img_CujE"></p>
<!-- -->
<div class="cta_Vy7l"><div class="ctaContainer_dzq8"><div class="ctaImage_MZ5b"><img src="https://www.debugbear.com/dimg/57001785e35454b95f43aa4f3bf6f857.png" alt="Illustration of website monitoring" class="themedComponent_mlkZ themedComponent--light_NVdE"><img src="https://www.debugbear.com/dimg/b2c0ae7a8dfbc4b18ba827a334c5c1af.png" alt="Illustration of website monitoring" class="themedComponent_mlkZ themedComponent--dark_xIcU"></div><div class="ctaContent_VgWi"><h2>Monitor Page Speed &amp; Core Web Vitals</h2><div class="ctaBenefits_OYw7"><h3>DebugBear monitoring includes:</h3><ul><li>In-depth Page Speed Reports</li><li>Automated Recommendations</li><li>Real User Analytics Data</li></ul></div><div><a href="https://www.debugbear.com/signup" class="ctaButton_Uos9 hidden-when-logged-in"><span>Start Free Trial</span></a><a href="https://www.debugbear.com/app" class="ctaButton_Uos9 visible-when-logged-in"><span>Go To App</span></a></div></div></div></div>]]></content>
        <author>
            <name>Matt Zeunert</name>
        </author>
    </entry>
    <entry>
        <title type="html"><![CDATA[Top 5 Alternatives To Uptrends In 2026]]></title>
        <id>https://www.debugbear.com/software/uptrends-alternatives</id>
        <link href="https://www.debugbear.com/software/uptrends-alternatives"/>
        <updated>2026-01-03T00:00:00.000Z</updated>
        <summary type="html"><![CDATA[Discover the best Uptrends alternatives for website monitoring, uptime tracking, and performance testing in 2026.]]></summary>
        <content type="html"><![CDATA[<p>Uptrends is a <a href="https://www.debugbear.com/software/best-website-monitoring-tools">website monitoring service</a> run by ITRS. It keeps track of website availability and performance.</p>
<p>In this article, we'll explore the top Uptrends alternatives for 2026, covering tools that specialize in different aspects of website monitoring and performance testing.</p>
<h2 class="anchor anchorWithStickyNavbar_FNw8" id="1-debugbear">1. DebugBear<a href="https://www.debugbear.com/software/uptrends-alternatives#1-debugbear" class="hash-link" aria-label="Direct link to 1. DebugBear" title="Direct link to 1. DebugBear">​</a></h2>
<p>If website performance is important to you, <a href="https://www.debugbear.com/">DebugBear</a> provides comprehensive monitoring and advanced technical reports. The tool focuses on user experience and Google's <a href="https://www.debugbear.com/docs/metrics/core-web-vitals">Core Web Vitals</a> metrics.</p>
<p>DebugBear supports both scheduled synthetic tests as well as real user analytics. You can also use DebugBear to analyze data from <a href="https://www.debugbear.com/blog/chrome-user-experience-report">Google's Chrome User Experience Report</a>.</p>
<p><img loading="lazy" src="https://www.debugbear.com/dimg/c2cdeee7765b7fa67e9d490a233191ed.png" alt="DebugBear monitoring dashboard" style="border-radius:4px" data-abc="true" class="img_CujE"></p>
<p>The <a href="https://www.debugbear.com/real-user-monitoring">real user monitoring product</a> surfaces how actual visitor experience varies across your website. Identify slow pages and deep-dive into slow interactions.</p>
<p>You can also record custom metrics and page view tags.</p>
<p><img loading="lazy" src="https://www.debugbear.com/dimg/0c29f360d8ebdef8e6c867b0c9204cd3.png" alt="Real user monitoring dashboard" style="border-radius:4px" data-abc="true" class="img_CujE"></p>
<p>The <a href="https://www.debugbear.com/synthetic-website-monitoring">synthetic monitoring product</a> lets you run regular website checks from 30 different test locations.</p>
<p>DebugBear also provides advanced features for identifying performance bottlenecks:</p>
<ul>
<li>Check rendering impact in the <a href="https://www.debugbear.com/docs/waterfall">request waterfall</a></li>
<li>Get tailored recommendations to <a href="https://www.debugbear.com/blog/improve-website-performance">improve web performance</a></li>
<li>Try out fixes using the <a href="https://www.debugbear.com/docs/experiments">experiments feature</a></li>
</ul>
<p><img loading="lazy" src="https://www.debugbear.com/dimg/98a248398828beaf004c01018e5f2524.png" alt="Synthetic monitoring data" style="border-radius:4px" data-abc="true" class="img_CujE"></p>
<p>DebugBear offers a <a href="https://www.debugbear.com/signup">free 14-day trial</a> before you sign up for a monthly or annual subscription.</p>
<h2 class="anchor anchorWithStickyNavbar_FNw8" id="2-pingdom">2. Pingdom<a href="https://www.debugbear.com/software/uptrends-alternatives#2-pingdom" class="hash-link" aria-label="Direct link to 2. Pingdom" title="Direct link to 2. Pingdom">​</a></h2>
<p><a href="https://www.debugbear.com/software/pingdom-speed-test">Pingdom</a> is a website monitoring platform that has been around for a long time. Like Uptrends, it provides both real user metrics and synthetic testing.</p>
<p>The product keeps track of key page speed metrics like load time and page weight. However, the metrics it tracks are more traditional technical ones, rather than more modern user-centric metrics.</p>
<p><img loading="lazy" src="https://www.debugbear.com/dimg/751e92e046271732e9fc3c9cc9b91c95.png" alt="Pingdom performance dashboard" style="border-radius:4px" data-abc="true" class="img_CujE"></p>
<p>You can configure pingdom to alert you to page speed regressions and outages. Pingdom also lets you set up public status pages to keep your customers informed.</p>
<h2 class="anchor anchorWithStickyNavbar_FNw8" id="3-statusgator">3. StatusGator<a href="https://www.debugbear.com/software/uptrends-alternatives#3-statusgator" class="hash-link" aria-label="Direct link to 3. StatusGator" title="Direct link to 3. StatusGator">​</a></h2>
<p>StatusGator is an Uptrends alternative that focuses on website availability monitoring. However, it also provides a unique feature that's not included in Uptrends: third-party service status aggregation.</p>
<p>Providing information on the service providers you depend on means issues will be visible more quickly to your customers. It also helps your internal teams diagnose website issues and reduces support requests.</p>
<p><img loading="lazy" src="https://www.debugbear.com/dimg/c3bd5baf99deff2559b5141c263f99a4.png" alt="Third-party status dashboard" style="border-radius:4px" data-abc="true" class="img_CujE"></p>
<p>StatusGator focuses on website status specifically. Unlike Uptrends, it does not offer performance testing or transaction monitoring.</p>
<h2 class="anchor anchorWithStickyNavbar_FNw8" id="4-gtmetrix">4. GTmetrix<a href="https://www.debugbear.com/software/uptrends-alternatives#4-gtmetrix" class="hash-link" aria-label="Direct link to 4. GTmetrix" title="Direct link to 4. GTmetrix">​</a></h2>
<p><a href="https://www.debugbear.com/software/gtmetrix-speed-test">GTmetrix</a> is one of the most popular performance testing tools. You can also set it up to run scheduled synthetic tests.</p>
<p>The test result is based on Google's <a href="https://developers.google.com/web/tools/lighthouse" target="_blank" rel="noopener noreferrer">Lighthouse</a> library. You can configure tests to run from different locations, device types, and connection speeds.</p>
<p><img loading="lazy" src="https://www.debugbear.com/dimg/5e809c8ddfafae6ff3afc5d9776e0c05.png" alt="GTmetrix monitoring dashboard" style="border-radius:4px" data-abc="true" class="img_CujE"></p>
<p>After you've set up continuous monitoring, GTmetrix provides a history dashboard showing how your metrics have developed over time. You can also set up custom alerts to be notified of performance regressions.</p>
<h2 class="anchor anchorWithStickyNavbar_FNw8" id="5-dynatrace">5. Dynatrace<a href="https://www.debugbear.com/software/uptrends-alternatives#5-dynatrace" class="hash-link" aria-label="Direct link to 5. Dynatrace" title="Direct link to 5. Dynatrace">​</a></h2>
<p>Dynatrace is a comprehensive enterprise-level website monitoring platform. It covers uptime checks, synthetic performance testing, real user monitoring, and much more.</p>
<p><a href="https://www.debugbear.com/software/dynatrace-synthetic-monitoring">Dynatrace synthetic monitoring</a> supports a large number of test locations and advanced configuration options. However, the reporting and analysis features are less advanced compared to more specialized tools.</p>
<p><img loading="lazy" src="https://www.debugbear.com/dimg/79b61a8440b320a69494653788e0825b.png" alt="Dynatrace dashboard" style="border-radius:4px" data-abc="true" class="img_CujE"></p>
<h2 class="anchor anchorWithStickyNavbar_FNw8" id="whats-the-best-alternative-to-uptrends">What's the best alternative to Uptrends?<a href="https://www.debugbear.com/software/uptrends-alternatives#whats-the-best-alternative-to-uptrends" class="hash-link" aria-label="Direct link to What's the best alternative to Uptrends?" title="Direct link to What's the best alternative to Uptrends?">​</a></h2>
<p>The best Uptrends alternative depends on your specific monitoring needs:</p>
<ul>
<li>DebugBear is great if you prioritize Core Web Vitals and user experience</li>
<li>Dynatrace is a more comprehensive platform that reduces the need for multiple monitoring tools</li>
<li>StatusGator is ideal if you need to communicate website availability to customers or internal users.</li>
</ul>
<!-- -->
<div class="cta_Vy7l"><div class="ctaContainer_dzq8"><div class="ctaImage_MZ5b"><img src="https://www.debugbear.com/dimg/57001785e35454b95f43aa4f3bf6f857.png" alt="Illustration of website monitoring" class="themedComponent_mlkZ themedComponent--light_NVdE"><img src="https://www.debugbear.com/dimg/b2c0ae7a8dfbc4b18ba827a334c5c1af.png" alt="Illustration of website monitoring" class="themedComponent_mlkZ themedComponent--dark_xIcU"></div><div class="ctaContent_VgWi"><h2>Monitor Page Speed &amp; Core Web Vitals</h2><div class="ctaBenefits_OYw7"><h3>DebugBear monitoring includes:</h3><ul><li>In-depth Page Speed Reports</li><li>Automated Recommendations</li><li>Real User Analytics Data</li></ul></div><div><a href="https://www.debugbear.com/signup" class="ctaButton_Uos9 hidden-when-logged-in"><span>Start Free Trial</span></a><a href="https://www.debugbear.com/app" class="ctaButton_Uos9 visible-when-logged-in"><span>Go To App</span></a></div></div></div></div>]]></content>
        <author>
            <name>Matt Zeunert</name>
        </author>
    </entry>
    <entry>
        <title type="html"><![CDATA[How To Set Up Splunk Synthetic Monitoring]]></title>
        <id>https://www.debugbear.com/software/splunk-synthetic-monitoring</id>
        <link href="https://www.debugbear.com/software/splunk-synthetic-monitoring"/>
        <updated>2026-01-01T00:00:00.000Z</updated>
        <summary type="html"><![CDATA[Learn how to set up synthetic monitoring in Splunk to track website performance and availability with scheduled browser tests.]]></summary>
        <content type="html"><![CDATA[<p>Synthetic monitoring is one of the Splunk features you can use to continuously measure your website performance. This guide explains how to set up synthetic browser tests, view performance reports, and configure alerts.</p>
<h2 class="anchor anchorWithStickyNavbar_FNw8" id="what-is-splunk-synthetic-monitoring">What is Splunk Synthetic Monitoring?<a href="https://www.debugbear.com/software/splunk-synthetic-monitoring#what-is-splunk-synthetic-monitoring" class="hash-link" aria-label="Direct link to What is Splunk Synthetic Monitoring?" title="Direct link to What is Splunk Synthetic Monitoring?">​</a></h2>
<p><a href="https://www.debugbear.com/docs/synthetic-website-monitoring">Synthetic website monitoring</a> is one of the features of the Splunk Observability Cloud platform. It lets you run scheduled tests in a controlled test environment to keep track of uptime and page speed.</p>
<p>Synthetic testing is one of the features of Splunk's <a href="https://www.debugbear.com/software/digital-experience-monitoring">digital experience monitoring</a> capabilities that provide insight into user experience on your website. It complements <a href="https://www.debugbear.com/docs/what-is-real-user-monitoring">real user monitoring</a> by providing consistent data from a controlled environment.</p>
<h2 class="anchor anchorWithStickyNavbar_FNw8" id="create-a-new-synthetic-monitor">Create a new synthetic monitor<a href="https://www.debugbear.com/software/splunk-synthetic-monitoring#create-a-new-synthetic-monitor" class="hash-link" aria-label="Direct link to Create a new synthetic monitor" title="Direct link to Create a new synthetic monitor">​</a></h2>
<p>To start creating a new synthetic monitor, open "Digital Experience", select "Synthetic Tests", and finally click "Create new test".</p>
<p><img loading="lazy" src="https://www.debugbear.com/dimg/cff19232d44485b1a5118dca380207cf.png" alt="Finding the Splunk synthetic UI" style="border-radius:4px" data-abc="true" class="img_CujE"></p>
<p>Splunk supports several different types of synthetic tests:</p>
<ul>
<li>Browser test: open a website and optionally navigate through it</li>
<li>SSL test: check SSL certificate validity</li>
<li>API test: check performance and validity of API endpoints</li>
<li>HTTP test: check web server availability and response time</li>
<li>Port test: confirm a specific server port is accessible</li>
</ul>
<p>We'll go with the browser test to get as much insight into visitor experience as possible.</p>
<p><img loading="lazy" src="https://www.debugbear.com/dimg/5e20ac5b225e6b972c1bd4402dd104fe.png" alt="Selecting the browser test type" style="border-radius:4px" data-abc="true" class="img_CujE"></p>
<p>To set up a synthetic check we need to do at least two things: provide a name and configure transaction steps.</p>
<p>We can also configure additional options on how the test should run:</p>
<ul>
<li>What test locations should be used to load the website?</li>
<li>What should the size of the test device be?</li>
<li>How often should the test run?</li>
</ul>
<p>You can also set up advanced options like custom headers, cookies, or Chrome flags.</p>
<p><img loading="lazy" src="https://www.debugbear.com/dimg/507f7a29aa0a64daf2d3e11d42390451.png" alt="Browser test configuration options" style="border-radius:4px" data-abc="true" class="img_CujE"></p>
<div class="theme-admonition theme-admonition-tip admonition_LMjb alert alert--success"><div class="admonitionHeading_GGQ4"><span class="admonitionIcon_ifdW"><svg viewBox="0 0 12 16"><path fill-rule="evenodd" d="M6.5 0C3.48 0 1 2.19 1 5c0 .92.55 2.25 1 3 1.34 2.25 1.78 2.78 2 4v1h5v-1c.22-1.22.66-1.75 2-4 .45-.75 1-2.08 1-3 0-2.81-2.48-5-5.5-5zm3.64 7.48c-.25.44-.47.8-.67 1.11-.86 1.41-1.25 2.06-1.45 3.23-.02.05-.02.11-.02.17H5c0-.06 0-.13-.02-.17-.2-1.17-.59-1.83-1.45-3.23-.2-.31-.42-.67-.67-1.11C2.44 6.78 2 5.65 2 5c0-2.2 2.02-4 4.5-4 1.22 0 2.36.42 3.22 1.19C10.55 2.94 11 3.94 11 5c0 .66-.44 1.78-.86 2.48zM4 14h5c-.23 1.14-1.3 2-2.5 2s-2.27-.86-2.5-2z"></path></svg></span>tip</div><div class="admonitionContent_pGk6"><p>Splunk does not provide a way to throttle the network speed for synthetic tests. If you want to measure performance on a slower network consider using <a href="https://www.debugbear.com/">DebugBear</a> instead.</p></div></div>
<p>Click on "Edit steps or synthetic transactions" to specify the page URL you want to test.</p>
<p>Splunk supports <a href="https://www.debugbear.com/docs/synthetic-transaction-monitoring">synthetic transaction monitoring</a> where you can define multiple steps to load your website and interact with it. However, for now we'll just go with a simple URL test.</p>
<p>Click on "Return to test" once you've set up the transaction steps. Then click "Create" to finish the setup process.</p>
<p><img loading="lazy" src="https://www.debugbear.com/dimg/f62d18b53687ec71f0ef22e0f100e541.png" alt="Synthetic transaction steps" style="border-radius:4px" data-abc="true" class="img_CujE"></p>
<h2 class="anchor anchorWithStickyNavbar_FNw8" id="view-performance-data-over-time">View performance data over time<a href="https://www.debugbear.com/software/splunk-synthetic-monitoring#view-performance-data-over-time" class="hash-link" aria-label="Direct link to View performance data over time" title="Direct link to View performance data over time">​</a></h2>
<p>Once the test has run you'll start seeing <a href="https://www.debugbear.com/docs/web-performance-metrics">web performance metrics</a> and historical availability data in your dashboard.</p>
<p><img loading="lazy" src="https://www.debugbear.com/dimg/97e98aa57f0aa67cd7b961efa5112e38.png" alt="Monitoring dashboard" style="border-radius:4px" data-abc="true" class="img_CujE"></p>
<p>In addition to tracking the technical metrics and the total run time of the test you can also measure Google Core Web Vitals like <a href="https://www.debugbear.com/docs/metrics/largest-contentful-paint">Largest Contentful Paint</a> and <a href="https://www.debugbear.com/docs/metrics/cumulative-layout-shift">Cumulative Layout Shift</a>.</p>
<p><img loading="lazy" src="https://www.debugbear.com/dimg/dd156ae76baf4e683e13f3aee5a65d78.png" alt="Chart view with metric selection" style="border-radius:4px" data-abc="true" class="img_CujE"></p>
<div class="theme-admonition theme-admonition-tip admonition_LMjb alert alert--success"><div class="admonitionHeading_GGQ4"><span class="admonitionIcon_ifdW"><svg viewBox="0 0 12 16"><path fill-rule="evenodd" d="M6.5 0C3.48 0 1 2.19 1 5c0 .92.55 2.25 1 3 1.34 2.25 1.78 2.78 2 4v1h5v-1c.22-1.22.66-1.75 2-4 .45-.75 1-2.08 1-3 0-2.81-2.48-5-5.5-5zm3.64 7.48c-.25.44-.47.8-.67 1.11-.86 1.41-1.25 2.06-1.45 3.23-.02.05-.02.11-.02.17H5c0-.06 0-.13-.02-.17-.2-1.17-.59-1.83-1.45-3.23-.2-.31-.42-.67-.67-1.11C2.44 6.78 2 5.65 2 5c0-2.2 2.02-4 4.5-4 1.22 0 2.36.42 3.22 1.19C10.55 2.94 11 3.94 11 5c0 .66-.44 1.78-.86 2.48zM4 14h5c-.23 1.14-1.3 2-2.5 2s-2.27-.86-2.5-2z"></path></svg></span>tip</div><div class="admonitionContent_pGk6"><p>To track <a href="https://www.debugbear.com/docs/metrics/interaction-to-next-paint">Interaction to Next Paint</a> you need to set up <a href="https://www.debugbear.com/real-user-monitoring">real user monitoring</a>. However, <a href="https://www.debugbear.com/docs/metrics/total-blocking-time">Total Blocking Time</a> is available in synthetic tests and can provide partial insights into input delays.</p></div></div>
<h2 class="anchor anchorWithStickyNavbar_FNw8" id="review-specific-test-runs">Review specific test runs<a href="https://www.debugbear.com/software/splunk-synthetic-monitoring#review-specific-test-runs" class="hash-link" aria-label="Direct link to Review specific test runs" title="Direct link to Review specific test runs">​</a></h2>
<p>The "Recent test runs" table shows you when individual tests were run in each location. Click on a specific test run to view detailed performance data.</p>
<p><img loading="lazy" src="https://www.debugbear.com/dimg/78e4dd65aaa181d3c73404db998c281c.png" alt="List of test runs" style="border-radius:4px" data-abc="true" class="img_CujE"></p>
<p>The detailed test result includes a rendering filmstrip and video view that shows you how content on the page loaded gradually. Splunk also provides a breakdown of key performance metrics and a <a href="https://www.debugbear.com/blog/page-weight-website-speed">page weight</a> breakdown by resource type.</p>
<p>The <a href="https://www.debugbear.com/docs/waterfall">request waterfall</a> view shows you all resources that were loaded on the page and how long they took to load. You can inspect each request in more detail to view request and response headers as well as the HTTP status code and transfer protocol (e.g. <a href="https://www.debugbear.com/blog/http1-vs-http2">HTTP/2</a>).</p>
<p><img loading="lazy" src="https://www.debugbear.com/dimg/57b1e3c5ee817ff60e056e77a26e310e.png" alt="Splunk synthetic request waterfall" style="border-radius:4px" data-abc="true" class="img_CujE"></p>
<div class="theme-admonition theme-admonition-tip admonition_LMjb alert alert--success"><div class="admonitionHeading_GGQ4"><span class="admonitionIcon_ifdW"><svg viewBox="0 0 12 16"><path fill-rule="evenodd" d="M6.5 0C3.48 0 1 2.19 1 5c0 .92.55 2.25 1 3 1.34 2.25 1.78 2.78 2 4v1h5v-1c.22-1.22.66-1.75 2-4 .45-.75 1-2.08 1-3 0-2.81-2.48-5-5.5-5zm3.64 7.48c-.25.44-.47.8-.67 1.11-.86 1.41-1.25 2.06-1.45 3.23-.02.05-.02.11-.02.17H5c0-.06 0-.13-.02-.17-.2-1.17-.59-1.83-1.45-3.23-.2-.31-.42-.67-.67-1.11C2.44 6.78 2 5.65 2 5c0-2.2 2.02-4 4.5-4 1.22 0 2.36.42 3.22 1.19C10.55 2.94 11 3.94 11 5c0 .66-.44 1.78-.86 2.48zM4 14h5c-.23 1.14-1.3 2-2.5 2s-2.27-.86-2.5-2z"></path></svg></span>tip</div><div class="admonitionContent_pGk6"><p>The <a href="https://www.debugbear.com/test/website-speed">DebugBear website speed test</a> provides a more detailed breakdown of resources loaded on your website and how they impact page speed.</p><p>On top of that, the network is throttled using reliable <a href="https://www.debugbear.com/blog/packet-level-throttling">packet-level throttling</a> to better reflect real user conditions.</p><p><img loading="lazy" src="https://www.debugbear.com/dimg/56da76a4880ba88320d4e6ca60a81b6c.png" alt="Detailed web performance waterfall" style="border-radius:4px" data-abc="true" class="img_CujE"></p></div></div>
<h2 class="anchor anchorWithStickyNavbar_FNw8" id="set-up-alerting-with-detectors">Set up alerting with detectors<a href="https://www.debugbear.com/software/splunk-synthetic-monitoring#set-up-alerting-with-detectors" class="hash-link" aria-label="Direct link to Set up alerting with detectors" title="Direct link to Set up alerting with detectors">​</a></h2>
<p>Splunk detectors allow you to get alerted to performance issues and outages on your website. You define custom thresholds that determine when an alert is triggered.</p>
<p>To set up a detector, go to the list of synthetic monitors you've set up, click on the three dots on the right of the table, and select "Create Detector".</p>
<p><img loading="lazy" src="https://www.debugbear.com/dimg/772dfd3bde8646653b8650ad09fecdb9.png" alt="Creating a Splunk detector from the dashboard" style="border-radius:4px" data-abc="true" class="img_CujE"></p>
<p>The detector then lets you define what should trigger an alert and how you want to be notified.</p>
<ul>
<li>What metric do you want to check?</li>
<li>What threshold should trigger the alert?</li>
<li>Are alerts triggered right away or only on multiple consecutive failures?</li>
<li>What channels should notifications be sent to?</li>
</ul>
<p>Click "Activate" after configuring the detector to start receiving alerts for issues on your website.</p>
<p><img loading="lazy" src="https://www.debugbear.com/dimg/1d7e76cb0fc16932b3fba17ffdcc0cef.png" alt="Splunk detector configuration and state preview" style="border-radius:4px" data-abc="true" class="img_CujE"></p>
<p>You will then receive notifications when the detector threshold is breached and when the metric goes back to normal.</p>
<p>The alert message also shows you the recent metric values and how long the threshold has been breached.</p>
<p><img loading="lazy" src="https://www.debugbear.com/dimg/fb513c41dbc28cdb1f172267cfea1f09.png" alt="Splunk alert email" style="border-radius:4px" data-abc="true" class="img_CujE"></p>
<h2 class="anchor anchorWithStickyNavbar_FNw8" id="try-a-dedicated-web-performance-monitoring-solution">Try a dedicated web performance monitoring solution<a href="https://www.debugbear.com/software/splunk-synthetic-monitoring#try-a-dedicated-web-performance-monitoring-solution" class="hash-link" aria-label="Direct link to Try a dedicated web performance monitoring solution" title="Direct link to Try a dedicated web performance monitoring solution">​</a></h2>
<p>Splunk is a general-purpose observability platform that includes synthetic monitoring as one of its features. If you're looking for a tool that's focused on website performance monitoring consider using <a href="https://www.debugbear.com/">DebugBear</a> for more detailed insights and performance recommendations.</p>
<p>Our synthetic monitoring product provides both a high-level view of user experience as well as deep technical reports.</p>
<p><img loading="lazy" src="https://www.debugbear.com/dimg/3aead05afbc69cc419de86394f376f01.png" alt="Synthetic monitoring trend data and reporting" style="border-radius:4px" data-abc="true" class="img_CujE"></p>
<p>Each test result includes a full Lighthouse report, as well as custom performance recommendations to help you <a href="https://www.debugbear.com/blog/improve-website-performance">optimize your website performance</a>. You can use <a href="https://www.debugbear.com/docs/experiments">experiments</a> to track how specific changes would impact page speed, without having to deploy any code changes on your live site.</p>
<p>Want to learn more about how to use this in practice? We recently published a real-world <a href="https://www.debugbear.com/blog/splunk-website-performance">performance review of the Splunk homepage</a>, highlighting specific optimizations that could be made.</p>
<p><img loading="lazy" src="https://www.debugbear.com/dimg/32871a0ec23793aa579e14a9d49b40c9.png" alt="Custom performance recommendations" style="border-radius:4px" data-abc="true" class="img_CujE"></p>
<!-- -->
<div class="cta_Vy7l"><div class="ctaContainer_dzq8"><div class="ctaImage_MZ5b"><img src="https://www.debugbear.com/dimg/57001785e35454b95f43aa4f3bf6f857.png" alt="Illustration of website monitoring" class="themedComponent_mlkZ themedComponent--light_NVdE"><img src="https://www.debugbear.com/dimg/b2c0ae7a8dfbc4b18ba827a334c5c1af.png" alt="Illustration of website monitoring" class="themedComponent_mlkZ themedComponent--dark_xIcU"></div><div class="ctaContent_VgWi"><h2>Monitor Page Speed &amp; Core Web Vitals</h2><div class="ctaBenefits_OYw7"><h3>DebugBear monitoring includes:</h3><ul><li>In-depth Page Speed Reports</li><li>Automated Recommendations</li><li>Real User Analytics Data</li></ul></div><div><a href="https://www.debugbear.com/signup" class="ctaButton_Uos9 hidden-when-logged-in"><span>Start Free Trial</span></a><a href="https://www.debugbear.com/app" class="ctaButton_Uos9 visible-when-logged-in"><span>Go To App</span></a></div></div></div></div>]]></content>
        <author>
            <name>Matt Zeunert</name>
        </author>
    </entry>
    <entry>
        <title type="html"><![CDATA[The Uptrends Website Speed Test: Measure Global Performance]]></title>
        <id>https://www.debugbear.com/software/uptrends-website-speed-test</id>
        <link href="https://www.debugbear.com/software/uptrends-website-speed-test"/>
        <updated>2025-12-20T00:00:00.000Z</updated>
        <summary type="html"><![CDATA[Learn how to use the Uptrends website speed test to measure page performance from 20 global locations.]]></summary>
        <content type="html"><![CDATA[<p>The Uptrends website speed test is a free tool that helps you analyze the page load performance of your website. This guide explains how to run tests and interpret the results.</p>
<h2 class="anchor anchorWithStickyNavbar_FNw8" id="what-is-the-uptrends-website-speed-test">What is the Uptrends website speed test?<a href="https://www.debugbear.com/software/uptrends-website-speed-test#what-is-the-uptrends-website-speed-test" class="hash-link" aria-label="Direct link to What is the Uptrends website speed test?" title="Direct link to What is the Uptrends website speed test?">​</a></h2>
<p>The Uptrends web performance test lets you see how quickly your website loads from different locations around the world. It provides a detailed report with performance metrics and a <a href="https://www.debugbear.com/docs/waterfall">request waterfall</a> visualization.</p>
<p>Uptrends is based on the open-source <a href="https://www.debugbear.com/blog/lighthouse-page-speed">Lighthouse</a> tool that also powers PageSpeed Insights. However, it complements the Lighthouse report with custom reporting and analysis.</p>
<h2 class="anchor anchorWithStickyNavbar_FNw8" id="how-to-test-your-website-with-uptrends">How to test your website with Uptrends<a href="https://www.debugbear.com/software/uptrends-website-speed-test#how-to-test-your-website-with-uptrends" class="hash-link" aria-label="Direct link to How to test your website with Uptrends" title="Direct link to How to test your website with Uptrends">​</a></h2>
<p>To test your website, open the <a href="https://www.uptrends.com/tools/website-speed-test" target="_blank" rel="noopener noreferrer">free Uptrends speed test</a> and enter your website URL.</p>
<p>Decide if you want to run the test from a mobile or desktop device, pick a test location, and select a throttled network speed to make sure your metrics reflect real user conditions rather than a fast server environment.</p>
<p>Uptrends also lets you configure a custom screen size and pick either Chrome or Edge as the test browser. Click "Start Test" to run the performance analysis.</p>
<p><img loading="lazy" src="https://www.debugbear.com/dimg/297ad940f0de00b4273280bbc9eed4c5.png" alt="Starting the Uptrends website speed test" style="border-radius:4px" data-abc="true" class="img_CujE"></p>
<p>One strength of the Uptrends speed test is that it lets you run <a href="https://www.debugbear.com/docs/check-site-speed-from-multiple-locations">page speed tests from multiple global locations</a>. Select one of 20 options from Amsterdam to Montreal or Vancouver.</p>
<p><img loading="lazy" src="https://www.debugbear.com/dimg/5702e588d6e38d8dd8b776c8c62cea69.png" alt="Uptrends location selection" style="border-radius:4px" data-abc="true" class="img_CujE"></p>
<h2 class="anchor anchorWithStickyNavbar_FNw8" id="analyze-the-uptrends-speed-test-result">Analyze the Uptrends speed test result<a href="https://www.debugbear.com/software/uptrends-website-speed-test#analyze-the-uptrends-speed-test-result" class="hash-link" aria-label="Direct link to Analyze the Uptrends speed test result" title="Direct link to Analyze the Uptrends speed test result">​</a></h2>
<p>Once the test is complete, Uptrends shows you a summary of the test result, including the <a href="https://www.debugbear.com/docs/metrics/lighthouse-performance">Lighthouse performance score</a>, <a href="https://www.debugbear.com/docs/page-load-time">page load time</a>, and <a href="https://www.debugbear.com/blog/page-weight-website-speed">page weight</a>.</p>
<p>Uptrends also shows some of the performance opportunities identified by Lighthouse, in this case <a href="https://www.debugbear.com/blog/reduce-unused-javascript">reducing unused JavaScript code</a>.</p>
<p><img loading="lazy" src="https://www.debugbear.com/dimg/2e0b28f26c202ab57fc33c632c79e573.png" alt="Uptrends website speed test result" style="border-radius:4px" data-abc="true" class="img_CujE"></p>
<h3 class="anchor anchorWithStickyNavbar_FNw8" id="core-web-vitals-and-w3c-navigation-timings">Core Web Vitals and W3C Navigation Timings<a href="https://www.debugbear.com/software/uptrends-website-speed-test#core-web-vitals-and-w3c-navigation-timings" class="hash-link" aria-label="Direct link to Core Web Vitals and W3C Navigation Timings" title="Direct link to Core Web Vitals and W3C Navigation Timings">​</a></h3>
<p>Uptrends also reports <a href="https://www.debugbear.com/docs/metrics/core-web-vitals">Core Web Vitals</a> metrics like <a href="https://www.debugbear.com/docs/metrics/largest-contentful-paint">Largest Contentful Paint</a> and <a href="https://www.debugbear.com/docs/metrics/cumulative-layout-shift">Cumulative Layout Shift</a>. These metrics help you understand visitor experience on your website.</p>
<p><a href="https://www.debugbear.com/docs/synthetic-website-monitoring">Synthetic tests</a> don't include interactions by default, so the <a href="https://www.debugbear.com/docs/metrics/interaction-to-next-paint">Interaction to Next Paint</a> metric cannot be measured. However, Uptrends reports the <a href="https://www.debugbear.com/docs/metrics/total-blocking-time">Total Blocking Time</a> metric to highlight potential interaction delays during the page load process.</p>
<p>Uptrends also shows a set of W3C Navigation Timing metrics: these are older technical metrics that describe when different page load milestones occur. For example, you can measure <a href="https://www.debugbear.com/docs/metrics/time-to-first-byte">Time to First Byte</a> and the <a href="https://www.debugbear.com/blog/load-event">Load Event</a>.</p>
<p>The filmstrip view visually shows each rendering stage.</p>
<p><img loading="lazy" src="https://www.debugbear.com/dimg/9c33c035e4629c80ecb45bb376758837.png" alt="Core Web Vitals and filmstrip view in Uptrends" style="border-radius:4px" data-abc="true" class="img_CujE"></p>
<div class="theme-admonition theme-admonition-tip admonition_LMjb alert alert--success"><div class="admonitionHeading_GGQ4"><span class="admonitionIcon_ifdW"><svg viewBox="0 0 12 16"><path fill-rule="evenodd" d="M6.5 0C3.48 0 1 2.19 1 5c0 .92.55 2.25 1 3 1.34 2.25 1.78 2.78 2 4v1h5v-1c.22-1.22.66-1.75 2-4 .45-.75 1-2.08 1-3 0-2.81-2.48-5-5.5-5zm3.64 7.48c-.25.44-.47.8-.67 1.11-.86 1.41-1.25 2.06-1.45 3.23-.02.05-.02.11-.02.17H5c0-.06 0-.13-.02-.17-.2-1.17-.59-1.83-1.45-3.23-.2-.31-.42-.67-.67-1.11C2.44 6.78 2 5.65 2 5c0-2.2 2.02-4 4.5-4 1.22 0 2.36.42 3.22 1.19C10.55 2.94 11 3.94 11 5c0 .66-.44 1.78-.86 2.48zM4 14h5c-.23 1.14-1.3 2-2.5 2s-2.27-.86-2.5-2z"></path></svg></span>tip</div><div class="admonitionContent_pGk6"><p>A <a href="https://www.debugbear.com/real-user-monitoring">real user monitoring</a> tool can help track poor INP scores and see what page elements users interacted with.</p><p><img loading="lazy" src="https://www.debugbear.com/dimg/fedf0bba7b491a8c829914aa9747d25b.png" alt="INP real user monitoring dashboard" style="border-radius:4px" data-abc="true" class="img_CujE"></p><p>Thanks to Chrome's <a href="https://www.debugbear.com/blog/long-animation-frames">Long Animation Frames API</a> it's also possible to identify specific scripts that slowed down user interactions.</p><p><img loading="lazy" src="https://www.debugbear.com/dimg/c8ea8b8c4c8b6e94db0c19a9ed83200b.png" alt="Long Animation Frames data showing INP script delays" style="border-radius:4px" data-abc="true" class="img_CujE"></p></div></div>
<h3 class="anchor anchorWithStickyNavbar_FNw8" id="request-analysis-and-waterfall-view">Request analysis and waterfall view<a href="https://www.debugbear.com/software/uptrends-website-speed-test#request-analysis-and-waterfall-view" class="hash-link" aria-label="Direct link to Request analysis and waterfall view" title="Direct link to Request analysis and waterfall view">​</a></h3>
<p>Uptrends provides detailed data of what resources were loaded on the tested page. You can break page weight down by resource type or domain name.</p>
<p><img loading="lazy" src="https://www.debugbear.com/dimg/d1264c091e8bf9b0aeab898e65ed00bd.png" alt="Uptrends request analysis" style="border-radius:4px" data-abc="true" class="img_CujE"></p>
<p>The request waterfall shows you the URL of each request and when the resource was loaded. The request waterfall also shows additional details:</p>
<ul>
<li>The protocol used for the connection</li>
<li>The download size of each resource</li>
<li>The request duration breakdown into DNS resolution, TCP connection time, HTTPS handshake, and other components</li>
</ul>
<p><img loading="lazy" src="https://www.debugbear.com/dimg/30df5d6211815116b16a036b3071de8a.png" alt="Uptrends request waterfall" style="border-radius:4px" data-abc="true" class="img_CujE"></p>
<p>Uptrends also shows key page load milestones in the waterfall, for example <a href="https://www.debugbear.com/docs/metrics/first-contentful-paint">First Contentful Paint</a> and <a href="https://www.debugbear.com/docs/metrics/time-to-interactive">Time to Interactive</a>.</p>
<div class="theme-admonition theme-admonition-tip admonition_LMjb alert alert--success"><div class="admonitionHeading_GGQ4"><span class="admonitionIcon_ifdW"><svg viewBox="0 0 12 16"><path fill-rule="evenodd" d="M6.5 0C3.48 0 1 2.19 1 5c0 .92.55 2.25 1 3 1.34 2.25 1.78 2.78 2 4v1h5v-1c.22-1.22.66-1.75 2-4 .45-.75 1-2.08 1-3 0-2.81-2.48-5-5.5-5zm3.64 7.48c-.25.44-.47.8-.67 1.11-.86 1.41-1.25 2.06-1.45 3.23-.02.05-.02.11-.02.17H5c0-.06 0-.13-.02-.17-.2-1.17-.59-1.83-1.45-3.23-.2-.31-.42-.67-.67-1.11C2.44 6.78 2 5.65 2 5c0-2.2 2.02-4 4.5-4 1.22 0 2.36.42 3.22 1.19C10.55 2.94 11 3.94 11 5c0 .66-.44 1.78-.86 2.48zM4 14h5c-.23 1.14-1.3 2-2.5 2s-2.27-.86-2.5-2z"></path></svg></span>tip</div><div class="admonitionContent_pGk6"><p>You may notice that the Uptrends speed test shows resources loading quickly even on a slow connection. That's because the requests are not slowed down when the data is collected. Instead, Uptrends uses <a href="https://www.debugbear.com/blog/simulated-throttling">simulated throttling</a> to calculate the Lighthouse Performance score.</p><p>Try the free DebugBear <a href="https://www.debugbear.com/test/website-speed">website speed test</a> if you want to see a request waterfall with real throttling applied.</p></div></div>
<h3 class="anchor anchorWithStickyNavbar_FNw8" id="view-page-source-and-console-logs">View page source and console logs<a href="https://www.debugbear.com/software/uptrends-website-speed-test#view-page-source-and-console-logs" class="hash-link" aria-label="Direct link to View page source and console logs" title="Direct link to View page source and console logs">​</a></h3>
<p>In addition to the performance reporting, Uptrends also shows you the source code for the HTML document as well as any console log messages that were emitted by the browser during the page load.</p>
<p>This can help you debug whether the page loaded correctly and check how different page resources are referenced in the HTML.</p>
<p><img loading="lazy" src="https://www.debugbear.com/dimg/ca82941615129390c8cff0d0f58b2bc5.png" alt="Uptrends page source and log output" style="border-radius:4px" data-abc="true" class="img_CujE"></p>
<h2 class="anchor anchorWithStickyNavbar_FNw8" id="get-more-advanced-performance-insights">Get more advanced performance insights<a href="https://www.debugbear.com/software/uptrends-website-speed-test#get-more-advanced-performance-insights" class="hash-link" aria-label="Direct link to Get more advanced performance insights" title="Direct link to Get more advanced performance insights">​</a></h2>
<p><a href="https://www.debugbear.com/">DebugBear</a> page speed testing can help you get a better understanding of your website performance and monitor Core Web Vitals and other metrics continuously.</p>
<p>On top of running on-demand tests, the DebugBear test result also includes real visitor data from Google's <a href="https://www.debugbear.com/blog/chrome-user-experience-report">Chrome User Experience Report</a>.</p>
<p><img loading="lazy" src="https://www.debugbear.com/dimg/37cf4b4650ec7b0454ba87a91c52b46b.png" alt="DebugBear page speed test result" style="border-radius:4px" data-abc="true" class="img_CujE"></p>
<p>The request waterfall can help you investigate performance issues in more detail. All data is collected on a throttled connection to reflect real user conditions, using <a href="https://www.debugbear.com/blog/packet-level-throttling">packet-level network throttling</a> to provide reliable results.</p>
<p>Each test result includes a full Lighthouse report, as well as over 20 custom performance recommendations. Quickly measure the impact of optimizations with <a href="https://www.debugbear.com/docs/experiments">experiments</a> so your development team can focus on the most important fixes. <a href="https://www.debugbear.com/signup">Sign up for a free trial</a>.</p>
<p><img loading="lazy" src="https://www.debugbear.com/dimg/387c5d6048c7f15daec7da7cfbb94c69.png" alt="DebugBear request waterfall" style="border-radius:4px" data-abc="true" class="img_CujE"></p>
<!-- -->
<div class="cta_Vy7l"><div class="ctaContainer_dzq8"><div class="ctaImage_MZ5b"><img src="https://www.debugbear.com/dimg/57001785e35454b95f43aa4f3bf6f857.png" alt="Illustration of website monitoring" class="themedComponent_mlkZ themedComponent--light_NVdE"><img src="https://www.debugbear.com/dimg/b2c0ae7a8dfbc4b18ba827a334c5c1af.png" alt="Illustration of website monitoring" class="themedComponent_mlkZ themedComponent--dark_xIcU"></div><div class="ctaContent_VgWi"><h2>Monitor Page Speed &amp; Core Web Vitals</h2><div class="ctaBenefits_OYw7"><h3>DebugBear monitoring includes:</h3><ul><li>In-depth Page Speed Reports</li><li>Automated Recommendations</li><li>Real User Analytics Data</li></ul></div><div><a href="https://www.debugbear.com/signup" class="ctaButton_Uos9 hidden-when-logged-in"><span>Start Free Trial</span></a><a href="https://www.debugbear.com/app" class="ctaButton_Uos9 visible-when-logged-in"><span>Go To App</span></a></div></div></div></div>]]></content>
        <author>
            <name>Matt Zeunert</name>
        </author>
    </entry>
    <entry>
        <title type="html"><![CDATA[GTmetrix vs. PageSpeed Insights and WebPageTest: A Comparison]]></title>
        <id>https://www.debugbear.com/software/gtmetrix-vs-pagespeed-insights-vs-webpagetest</id>
        <link href="https://www.debugbear.com/software/gtmetrix-vs-pagespeed-insights-vs-webpagetest"/>
        <updated>2025-12-19T00:00:00.000Z</updated>
        <summary type="html"><![CDATA[Compare GTmetrix, PageSpeed Insights, WebPageTest, and Pingdom to understand which page speed testing tool provides the most reliable performance data.]]></summary>
        <content type="html"><![CDATA[<p>GTmetrix and other tools let you measure page speed and identify ways to <a href="https://www.debugbear.com/blog/improve-website-performance">improve your website performance</a>.</p>
<p>But how is GTmetrix different, and what tools provide data you can trust? In this article we'll compare GTmetrix to <a href="https://www.debugbear.com/blog/pagespeed-insights">Google's PageSpeed Insights</a> tool as well as <a href="https://www.debugbear.com/software/webpagetest">WebPageTest</a> by Catchpoint and <a href="https://www.debugbear.com/software/pingdom-speed-test">Pingdom</a>.</p>
<h2 class="anchor anchorWithStickyNavbar_FNw8" id="gtmetrix-vs-pagespeed-insights">GTmetrix vs. PageSpeed Insights<a href="https://www.debugbear.com/software/gtmetrix-vs-pagespeed-insights-vs-webpagetest#gtmetrix-vs-pagespeed-insights" class="hash-link" aria-label="Direct link to GTmetrix vs. PageSpeed Insights" title="Direct link to GTmetrix vs. PageSpeed Insights">​</a></h2>
<p>GTmetrix and PageSpeed Insights are both based on Google's open-source <a href="https://www.debugbear.com/blog/lighthouse-page-speed">Lighthouse</a> library. It analyzes page load time on your website, provides a performance score, and suggests optimizations.</p>
<p>Crucially, GTmetrix also adds monitoring on top of on-demand tests. You can set up <a href="https://www.debugbear.com/docs/synthetic-website-monitoring">regular synthetic performance tests</a> to track your website performance over time and get alerted when something breaks.</p>
<p>While PageSpeed Insights also provides an assessment of accessibility and on-page SEO, GTmetrix focuses specifically on page load time.</p>
<p>GTmetrix also provides additional reporting, like a <a href="https://www.debugbear.com/docs/waterfall">request waterfall view</a> and a video recording of the page load process.</p>
<p><img loading="lazy" src="https://www.debugbear.com/dimg/8f598d549a5dcae9e1570ae1d312ee69.png" alt="GTmetrix test result" style="border-radius:4px" data-abc="true" class="img_CujE"></p>
<h3 class="anchor anchorWithStickyNavbar_FNw8" id="metric-discrepancies-should-you-trust-gtmetrix-or-pagespeed-insights">Metric discrepancies: should you trust GTmetrix or PageSpeed Insights?<a href="https://www.debugbear.com/software/gtmetrix-vs-pagespeed-insights-vs-webpagetest#metric-discrepancies-should-you-trust-gtmetrix-or-pagespeed-insights" class="hash-link" aria-label="Direct link to Metric discrepancies: should you trust GTmetrix or PageSpeed Insights?" title="Direct link to Metric discrepancies: should you trust GTmetrix or PageSpeed Insights?">​</a></h3>
<p>There are two key reasons why you might see different metric values between GTmetrix and PageSpeed Insights:</p>
<ol>
<li>Differences in the test environment</li>
<li>Unreliable network throttling in PageSpeed Insights</li>
</ol>
<p>Different tools will always report varying performance scores. However, overall you can trust the GTmetrix results more than PageSpeed Insights.</p>
<h4 class="anchor anchorWithStickyNavbar_FNw8" id="differences-in-the-test-environment">Differences in the test environment<a href="https://www.debugbear.com/software/gtmetrix-vs-pagespeed-insights-vs-webpagetest#differences-in-the-test-environment" class="hash-link" aria-label="Direct link to Differences in the test environment" title="Direct link to Differences in the test environment">​</a></h4>
<p>Lab-based performance tests are always run from a specific test location on a device with a certain CPU speed using a specific version of Lighthouse or Chrome.</p>
<p>Different test environments will always result in different metric values. The server running GTmetrix is not the same as the one running PageSpeed Insights. In turn, if you run Lighthouse on your own computer using <a href="https://www.debugbear.com/blog/use-chrome-devtools">Chrome DevTools</a> that is again another environment.</p>
<p>None of these environments is "more correct" than the others!</p>
<div class="theme-admonition theme-admonition-tip admonition_LMjb alert alert--success"><div class="admonitionHeading_GGQ4"><span class="admonitionIcon_ifdW"><svg viewBox="0 0 12 16"><path fill-rule="evenodd" d="M6.5 0C3.48 0 1 2.19 1 5c0 .92.55 2.25 1 3 1.34 2.25 1.78 2.78 2 4v1h5v-1c.22-1.22.66-1.75 2-4 .45-.75 1-2.08 1-3 0-2.81-2.48-5-5.5-5zm3.64 7.48c-.25.44-.47.8-.67 1.11-.86 1.41-1.25 2.06-1.45 3.23-.02.05-.02.11-.02.17H5c0-.06 0-.13-.02-.17-.2-1.17-.59-1.83-1.45-3.23-.2-.31-.42-.67-.67-1.11C2.44 6.78 2 5.65 2 5c0-2.2 2.02-4 4.5-4 1.22 0 2.36.42 3.22 1.19C10.55 2.94 11 3.94 11 5c0 .66-.44 1.78-.86 2.48zM4 14h5c-.23 1.14-1.3 2-2.5 2s-2.27-.86-2.5-2z"></path></svg></span>tip</div><div class="admonitionContent_pGk6"><p>Check the test configuration like server location, bandwidth, and CPU speed for any two test results you're comparing.</p></div></div>
<h4 class="anchor anchorWithStickyNavbar_FNw8" id="differences-in-how-network-and-cpu-throttling-is-applied">Differences in how network and CPU throttling is applied<a href="https://www.debugbear.com/software/gtmetrix-vs-pagespeed-insights-vs-webpagetest#differences-in-how-network-and-cpu-throttling-is-applied" class="hash-link" aria-label="Direct link to Differences in how network and CPU throttling is applied" title="Direct link to Differences in how network and CPU throttling is applied">​</a></h4>
<p><a href="https://www.debugbear.com/blog/is-pagespeed-insights-reliable">PageSpeed Insights is sometimes unreliable</a>, because it uses a less accurate way of throttling the network and CPU speed.</p>
<p>Take a look at the screenshot of the Lighthouse test settings below. It says "(Simulated)" after the throttling settings, indicating that PageSpeed Insights is using <a href="https://www.debugbear.com/blog/simulated-throttling">simulated throttling</a>.</p>
<p><img loading="lazy" src="https://www.debugbear.com/dimg/14df5b938df4afb0acf60e9725eb26ea.png" alt="Lighthouse test environment details" style="border-radius:4px" data-abc="true" class="img_CujE"></p>
<p>In contrast, GTmetrix actually slows down the network and CPU processing and then reports the values observed when loading the page. Since the throttling simulation sometimes doesn't match real browser behavior, the GTmetrix results are more reliable.</p>
<h3 class="anchor anchorWithStickyNavbar_FNw8" id="google-crux-data">Google CrUX data<a href="https://www.debugbear.com/software/gtmetrix-vs-pagespeed-insights-vs-webpagetest#google-crux-data" class="hash-link" aria-label="Direct link to Google CrUX data" title="Direct link to Google CrUX data">​</a></h3>
<p>In addition to the lab-based tests, both GTmetrix and PageSpeed Insights also report real user metrics.</p>
<p>This data is equally reliable in both tools, because both use <a href="https://www.debugbear.com/blog/chrome-user-experience-report">Google's Chrome User Experience Report (CrUX)</a> as the data source.</p>
<p><img loading="lazy" src="https://www.debugbear.com/dimg/b5131c1785af438d5302db593b862362.png" alt="CrUX metrics" style="border-radius:4px" data-abc="true" class="img_CujE"></p>
<h2 class="anchor anchorWithStickyNavbar_FNw8" id="gtmetrix-vs-webpagetest">GTmetrix vs. WebPageTest<a href="https://www.debugbear.com/software/gtmetrix-vs-pagespeed-insights-vs-webpagetest#gtmetrix-vs-webpagetest" class="hash-link" aria-label="Direct link to GTmetrix vs. WebPageTest" title="Direct link to GTmetrix vs. WebPageTest">​</a></h2>
<p>WebPageTest is another popular web performance testing tool. It also provides reliable data collection by applying <a href="https://www.debugbear.com/blog/packet-level-throttling">packet-level throttling</a> to the network connection when loading the page.</p>
<p>WebPageTest is a more advanced tool than GTmetrix, surfacing more performance metrics and detailed debug data. For example, WebPageTest can show you:</p>
<ul>
<li>What requests are <a href="https://www.debugbear.com/blog/render-blocking-resources">render-blocking</a></li>
<li>When data chunks arrive for different response bodies</li>
<li>How different server connections are used throughout the page load process</li>
<li>How much CPU processing time is spent on layout calculations or <a href="https://www.debugbear.com/docs/script-evaluation">script evaluation</a></li>
</ul>
<p><img loading="lazy" src="https://www.debugbear.com/dimg/a5c297e3a4f127237a0ec217ef812ffa.png" alt="WebPageTest waterfall" style="border-radius:4px" data-abc="true" class="img_CujE"></p>
<p>Unlike GTmetrix, WebPageTest is focused on running one-off performance tests. However, you can monitor performance metrics over time using Catchpoint's monitoring solution.</p>
<div class="theme-admonition theme-admonition-tip admonition_LMjb alert alert--success"><div class="admonitionHeading_GGQ4"><span class="admonitionIcon_ifdW"><svg viewBox="0 0 12 16"><path fill-rule="evenodd" d="M6.5 0C3.48 0 1 2.19 1 5c0 .92.55 2.25 1 3 1.34 2.25 1.78 2.78 2 4v1h5v-1c.22-1.22.66-1.75 2-4 .45-.75 1-2.08 1-3 0-2.81-2.48-5-5.5-5zm3.64 7.48c-.25.44-.47.8-.67 1.11-.86 1.41-1.25 2.06-1.45 3.23-.02.05-.02.11-.02.17H5c0-.06 0-.13-.02-.17-.2-1.17-.59-1.83-1.45-3.23-.2-.31-.42-.67-.67-1.11C2.44 6.78 2 5.65 2 5c0-2.2 2.02-4 4.5-4 1.22 0 2.36.42 3.22 1.19C10.55 2.94 11 3.94 11 5c0 .66-.44 1.78-.86 2.48zM4 14h5c-.23 1.14-1.3 2-2.5 2s-2.27-.86-2.5-2z"></path></svg></span>tip</div><div class="admonitionContent_pGk6"><p>The free DebugBear <a href="https://www.debugbear.com/test/website-speed">website speed test</a> is a more modern alternative to GTmetrix or WebPageTest. It provides reliable performance metrics, shows how the user experiences the page load, and suggests high-impact optimizations.</p><p><img loading="lazy" src="https://www.debugbear.com/dimg/4e24be8f0b927b0a6aca212a2c9b3ef7.png" alt="DebugBear performance test result" style="border-radius:4px" data-abc="true" class="img_CujE"></p><p>The DebugBear waterfall view shows the role of each resource for the rendering process and lets you see how resource load times determine what the user can see at each point in time.</p><p><img loading="lazy" src="https://www.debugbear.com/dimg/8ca9257d7d9b98dd55eddb4b13f21cfd.png" alt="DebugBear waterfall view" style="border-radius:4px" data-abc="true" class="img_CujE"></p></div></div>
<h2 class="anchor anchorWithStickyNavbar_FNw8" id="gtmetrix-vs-pingdom">GTmetrix vs. Pingdom<a href="https://www.debugbear.com/software/gtmetrix-vs-pagespeed-insights-vs-webpagetest#gtmetrix-vs-pingdom" class="hash-link" aria-label="Direct link to GTmetrix vs. Pingdom" title="Direct link to GTmetrix vs. Pingdom">​</a></h2>
<p>Pingdom is another web performance tool, built on the <a href="https://www.debugbear.com/software/yslow-alternatives">YSlow tool</a>. GTmetrix was also built on top of YSlow before switching to Lighthouse.</p>
<p>YSlow is older than Lighthouse and no longer actively maintained. Lighthouse also supports more modern <a href="https://www.debugbear.com/docs/web-performance-metrics">web performance metrics</a> that focus on user experience rather than technical page load milestones.</p>
<p>The free Pingdom speed test does not apply any network throttling by default. That means the metrics it reports will be lower than in other tools like GTmetrix or PageSpeed Insights, because the page is loaded on a fast network connection in a data center.</p>
<p>Like GTmetrix, Pingdom offers ongoing synthetic monitoring. It provides a more comprehensive monitoring platform that also includes uptime checks and <a href="https://www.debugbear.com/docs/what-is-real-user-monitoring">real user monitoring</a>.</p>
<h2 class="anchor anchorWithStickyNavbar_FNw8" id="using-debugbear-as-a-powerful-alternative-to-gtmetrix-and-pagespeed-insights">Using DebugBear as a powerful alternative to GTmetrix and PageSpeed Insights<a href="https://www.debugbear.com/software/gtmetrix-vs-pagespeed-insights-vs-webpagetest#using-debugbear-as-a-powerful-alternative-to-gtmetrix-and-pagespeed-insights" class="hash-link" aria-label="Direct link to Using DebugBear as a powerful alternative to GTmetrix and PageSpeed Insights" title="Direct link to Using DebugBear as a powerful alternative to GTmetrix and PageSpeed Insights">​</a></h2>
<p><a href="https://www.debugbear.com/">DebugBear</a> is a modern web performance monitoring tool with a focus on Core Web Vitals and user experience. You can run <a href="https://www.debugbear.com/synthetic-website-monitoring">synthetic performance tests</a> or collect <a href="https://www.debugbear.com/real-user-monitoring">real user analytics</a> to gain in-depth insights into how your website performs.</p>
<p>It also makes it easy to benchmark your website against competitors to see how you compare in your industry.</p>
<p><img loading="lazy" src="https://www.debugbear.com/dimg/093e481230b8e6e834f70689f4fa204e.png" alt="DebugBear performance benchmark" style="border-radius:4px" data-abc="true" class="img_CujE"></p>
<!-- -->
<div class="cta_Vy7l"><div class="ctaContainer_dzq8"><div class="ctaImage_MZ5b"><img src="https://www.debugbear.com/dimg/57001785e35454b95f43aa4f3bf6f857.png" alt="Illustration of website monitoring" class="themedComponent_mlkZ themedComponent--light_NVdE"><img src="https://www.debugbear.com/dimg/b2c0ae7a8dfbc4b18ba827a334c5c1af.png" alt="Illustration of website monitoring" class="themedComponent_mlkZ themedComponent--dark_xIcU"></div><div class="ctaContent_VgWi"><h2>Monitor Page Speed &amp; Core Web Vitals</h2><div class="ctaBenefits_OYw7"><h3>DebugBear monitoring includes:</h3><ul><li>In-depth Page Speed Reports</li><li>Automated Recommendations</li><li>Real User Analytics Data</li></ul></div><div><a href="https://www.debugbear.com/signup" class="ctaButton_Uos9 hidden-when-logged-in"><span>Start Free Trial</span></a><a href="https://www.debugbear.com/app" class="ctaButton_Uos9 visible-when-logged-in"><span>Go To App</span></a></div></div></div></div>]]></content>
        <author>
            <name>Matt Zeunert</name>
        </author>
    </entry>
    <entry>
        <title type="html"><![CDATA[A Guide To Dynatrace Real User Monitoring (RUM)]]></title>
        <id>https://www.debugbear.com/software/dynatrace-real-user-monitoring</id>
        <link href="https://www.debugbear.com/software/dynatrace-real-user-monitoring"/>
        <updated>2025-12-18T00:00:00.000Z</updated>
        <summary type="html"><![CDATA[Learn how to set up Dynatrace RUM to monitor real user performance, track Core Web Vitals, and debug page errors.]]></summary>
        <content type="html"><![CDATA[<p>Dynatrace is an observability platform that lets you monitor and analyze real user performance. This guide explains how to set up Dynatrace real user monitoring and how to use it for performance debugging.</p>
<h2 class="anchor anchorWithStickyNavbar_FNw8" id="what-is-dynatrace-rum">What is Dynatrace RUM?<a href="https://www.debugbear.com/software/dynatrace-real-user-monitoring#what-is-dynatrace-rum" class="hash-link" aria-label="Direct link to What is Dynatrace RUM?" title="Direct link to What is Dynatrace RUM?">​</a></h2>
<p>Dynatrace <a href="https://www.debugbear.com/docs/what-is-real-user-monitoring">real user monitoring</a> lets you track user experience data for real visitors on your website. For example, you can track web performance metrics, page errors, or view network requests for specific page views.</p>
<p>RUM works by installing a JavaScript snippet on your website. This snippet collects metrics and debug data about the visit and sends it to Dynatrace for processing and analysis.</p>
<div class="theme-admonition theme-admonition-info admonition_LMjb alert alert--info"><div class="admonitionHeading_GGQ4"><span class="admonitionIcon_ifdW"><svg viewBox="0 0 14 16"><path fill-rule="evenodd" d="M7 2.3c3.14 0 5.7 2.56 5.7 5.7s-2.56 5.7-5.7 5.7A5.71 5.71 0 0 1 1.3 8c0-3.14 2.56-5.7 5.7-5.7zM7 1C3.14 1 0 4.14 0 8s3.14 7 7 7 7-3.14 7-7-3.14-7-7-7zm1 3H6v5h2V4zm0 6H6v2h2v-2z"></path></svg></span>info</div><div class="admonitionContent_pGk6"><p>Many different <a href="https://www.debugbear.com/software/best-real-user-monitoring-tools">real user monitoring tools</a> are available on the market, each with a different focus. Some focus on performance metrics, others on user behavior analytics, and others on error tracking.</p></div></div>
<h2 class="anchor anchorWithStickyNavbar_FNw8" id="how-to-set-up-real-user-monitoring-with-dynatrace">How to set up real user monitoring with Dynatrace<a href="https://www.debugbear.com/software/dynatrace-real-user-monitoring#how-to-set-up-real-user-monitoring-with-dynatrace" class="hash-link" aria-label="Direct link to How to set up real user monitoring with Dynatrace" title="Direct link to How to set up real user monitoring with Dynatrace">​</a></h2>
<p>To set up real user monitoring, open the Experience Vitals tab in your dashboard. Here you need to add a frontend - the part of your application that's facing the user.</p>
<p>Dynatrace supports RUM for websites and mobile apps. Here we'll select "Web" as part of the setup process.</p>
<p><img loading="lazy" src="https://www.debugbear.com/dimg/df6b188856955b45c3c719c366bdd4d3.png" alt="Dynatrace frontend type selection" style="border-radius:4px" data-abc="true" class="img_CujE"></p>
<p>Enter a name for the frontend and then click on the "Next" button.</p>
<p>The next step is selecting the instrumentation method. That's how your data will be collected. There are two options:</p>
<ol>
<li>OneAgent Injection: Use this if OneAgent is already configured on your web server</li>
<li>Agentless: Add a JavaScript snippet to the page or add it to a tag manager</li>
</ol>
<p>In this example I'll go with the Agentless option.</p>
<p><img loading="lazy" src="https://www.debugbear.com/dimg/a25f05b05129de257b784c115b08ad0f.png" alt="Dynatrace instrumentation method selection" style="border-radius:4px" data-abc="true" class="img_CujE"></p>
<p>After moving to the next step, Dynatrace shows a bunch of optional configuration options:</p>
<ul>
<li>Do you want to track all page views or just a sample?</li>
<li>Do you want to enable Session Replay or Experience Analytics?</li>
<li>What privacy settings should the RUM code use?</li>
</ul>
<p><img loading="lazy" src="https://www.debugbear.com/dimg/e0ef9081cb368504740a7e9e6d11d734.png" alt="Dynatrace RUM configuration options" style="border-radius:4px" data-abc="true" class="img_CujE"></p>
<p>Once that's complete, Dynatrace provides the JavaScript snippet that you need to add to your website.</p>
<p>After installation, click on "Go to new frontend" and select "Analyze performance" to see what visitor data has been collected.</p>
<p><img loading="lazy" src="https://www.debugbear.com/dimg/2cccdc49afb4ca53958709058d892e01.png" alt="Dynatrace JavaScript tag" style="border-radius:4px" data-abc="true" class="img_CujE"></p>
<h2 class="anchor anchorWithStickyNavbar_FNw8" id="use-dynatrace-rum-data-for-performance-debugging">Use Dynatrace RUM data for performance debugging<a href="https://www.debugbear.com/software/dynatrace-real-user-monitoring#use-dynatrace-rum-data-for-performance-debugging" class="hash-link" aria-label="Direct link to Use Dynatrace RUM data for performance debugging" title="Direct link to Use Dynatrace RUM data for performance debugging">​</a></h2>
<p>Dynatrace RUM prominently features the <a href="https://www.debugbear.com/docs/metrics/core-web-vitals">Core Web Vitals</a> metrics that Google developed to assess user experience on the web:</p>
<ul>
<li><a href="https://www.debugbear.com/docs/metrics/largest-contentful-paint">Largest Contentful Paint</a> (LCP): how fast does the page load?</li>
<li><a href="https://www.debugbear.com/docs/metrics/cumulative-layout-shift">Cumulative Layout Shift</a> (CLS): is the page visually stable?</li>
<li><a href="https://www.debugbear.com/docs/metrics/interaction-to-next-paint">Interaction to Next Paint</a> (INP): how quickly does the page respond to user input?</li>
</ul>
<p>You can see this data broken down by page URL.</p>
<p><img loading="lazy" src="https://www.debugbear.com/dimg/2f1f7642705e9e44e0fe05de8c02a093.png" alt="Per-page performance data in Dynatrace RUM" style="border-radius:4px" data-abc="true" class="img_CujE"></p>
<p>Dynatrace also prominently highlights 6 other metrics:</p>
<ul>
<li><a href="https://www.debugbear.com/docs/metrics/time-to-first-byte">Time to First Byte</a> (TTFB): how long does it take for the server to respond?</li>
<li><a href="https://www.debugbear.com/blog/load-event">Load Event</a>: when does the page load event fire, indicating a full initial page load?</li>
<li>DOM Interactive: how long does it take for the HTML parser to reach the end of the page?</li>
<li>Error rate: how many page errors occur per minute?</li>
<li>Average foreground time: how long the user stayed on the page, excluding time when the page was in a background tab or window</li>
<li>Page visit rate: how often is the page loaded per minute?</li>
</ul>
<p>The Dynatrace RUM dashboard also lets you track how these metrics have changed over time.</p>
<p><img loading="lazy" src="https://www.debugbear.com/dimg/4b39bf451ad4eb40fa5e8368ebf103a8.png" alt="Largest Contentful Paint history in Dynatrace" style="border-radius:4px" data-abc="true" class="img_CujE"></p>
<h3 class="anchor anchorWithStickyNavbar_FNw8" id="waterfall-analysis">Waterfall analysis<a href="https://www.debugbear.com/software/dynatrace-real-user-monitoring#waterfall-analysis" class="hash-link" aria-label="Direct link to Waterfall analysis" title="Direct link to Waterfall analysis">​</a></h3>
<p>After selecting a particular page URL, the "Perform waterfall analysis" option becomes available. A <a href="https://www.debugbear.com/docs/waterfall">request waterfall</a> can tell you when different resources on the page are loaded.</p>
<p><img loading="lazy" src="https://www.debugbear.com/dimg/6645608984a2b53d84a77264eda8c753.png" alt="Dynatrace waterfall analysis button" style="border-radius:4px" data-abc="true" class="img_CujE"></p>
<p>This then takes you to a list of specific page instances: unique visits to each page.</p>
<p>Click on one visit to inspect the full request waterfall view.</p>
<p><img loading="lazy" src="https://www.debugbear.com/dimg/ca77e6e34966e9a19aae382480e90c32.png" alt="Dynatrace page instance list" style="border-radius:4px" data-abc="true" class="img_CujE"></p>
<p>The waterfall lists the network requests made on the page and shows key details about each one:</p>
<ul>
<li>Type: is it an HTML document, a script, or an image?</li>
<li>Name: the URL of the resource</li>
<li>Size: the transfer size of the resource</li>
<li>Duration: the total duration of the request</li>
<li>Initiator: was the resource loaded because of the initial navigation, or because of a specific HTML tag?</li>
<li><a href="https://www.debugbear.com/blog/render-blocking-resources">Render-blocking</a>: is the resource required before the page can start rendering content?</li>
</ul>
<p>Finally, you have the actual waterfall column on the right: this shows when the request started and finished, and how long each phase of the resource loading process took.</p>
<p><img loading="lazy" src="https://www.debugbear.com/dimg/79db9c6ec32fe5c3d16b28616f37637a.png" alt="Dynatrace request waterfall" style="border-radius:4px" data-abc="true" class="img_CujE"></p>
<p>You can also click on each request to view additional details. For example, you can see a breakdown of the different loading phases:</p>
<ul>
<li>Application cache lookup: checking if the resource is available in the cache</li>
<li>DNS lookup: looking up the IP address based on the domain name</li>
<li>TCP connect: time spent establishing a reliable <a href="https://www.debugbear.com/blog/http-server-connections">server connection</a></li>
<li>Request: <a href="https://www.debugbear.com/docs/metrics/time-to-first-byte">Time to First Byte</a> of the response body</li>
<li>Response: download time for the response content</li>
<li>TLS negotiation: time spent establishing a secure connection</li>
</ul>
<p><img loading="lazy" src="https://www.debugbear.com/dimg/89de3f6920e56603df5769074c733516.png" alt="Dynatrace request duration breakdown" style="border-radius:4px" data-abc="true" class="img_CujE"></p>
<h3 class="anchor anchorWithStickyNavbar_FNw8" id="break-down-and-debug-web-vitals-metrics">Break down and debug web vitals metrics<a href="https://www.debugbear.com/software/dynatrace-real-user-monitoring#break-down-and-debug-web-vitals-metrics" class="hash-link" aria-label="Direct link to Break down and debug web vitals metrics" title="Direct link to Break down and debug web vitals metrics">​</a></h3>
<p><a href="https://www.debugbear.com/blog/lcp-subparts">LCP subparts</a> data can tell you how much time was spent on each phase of loading the Largest Contentful Paint element. In Dynatrace, you can set up custom dashboards to find out what's causing delays.</p>
<p>To view the subparts data, create a new dashboard and run this DQL query.</p>
<pre tabindex="0" class="codeBlockStandalone_Nhx8 thin-scrollbar codeBlockContainer_aalF theme-code-block" style="--prism-color:#bfc7d5;--prism-background-color:#292d3e"><code class="codeBlockLines_RjmQ"><div class="codeBlockContainer_aalF theme-code-block" style="--prism-color:#bfc7d5;--prism-background-color:#292d3e"><div class="codeBlockContent_MHx8"><pre tabindex="0" class="prism-code language-text codeBlock_zHgq thin-scrollbar" style="color:#bfc7d5;background-color:#292d3e"><code class="codeBlockLines_RjmQ"><span class="token-line" style="color:#bfc7d5"><span class="token plain">fetch user.events</span><br></span><span class="token-line" style="color:#bfc7d5"><span class="token plain">| filter characteristics.has_page_summary == true</span><br></span><span class="token-line" style="color:#bfc7d5"><span class="token plain">| filter lcp.status == "reported"</span><br></span><span class="token-line" style="color:#bfc7d5"><span class="token plain">| summarize</span><br></span><span class="token-line" style="color:#bfc7d5"><span class="token plain">    LCP_p75          = percentile(web_vitals.largest_contentful_paint, 75),</span><br></span><span class="token-line" style="color:#bfc7d5"><span class="token plain">    TTFB_p75         = percentile(web_vitals.time_to_first_byte, 75),</span><br></span><span class="token-line" style="color:#bfc7d5"><span class="token plain">    LoadDelay_p75    = percentile(lcp.resource.load_delay, 75),</span><br></span><span class="token-line" style="color:#bfc7d5"><span class="token plain">    LoadDuration_p75 = percentile(lcp.resource.load_duration, 75),</span><br></span><span class="token-line" style="color:#bfc7d5"><span class="token plain">    RenderDelay_p75  = percentile(lcp.ui_element.render_delay, 75),</span><br></span><span class="token-line" style="color:#bfc7d5"><span class="token plain">    by: { page.name }</span><br></span><span class="token-line" style="color:#bfc7d5"><span class="token plain">| sort LCP_p75 desc</span><br></span></code></pre><div class="buttonGroup_Sd8_"><button type="button" aria-label="Copy code to clipboard" title="Copy" class="clean-btn"><span class="copyButtonIcons_LnQD" aria-hidden="true"><svg viewBox="0 0 24 24" class="copyButtonIcon_t3l1"><path fill="currentColor" d="M19,21H8V7H19M19,5H8A2,2 0 0,0 6,7V21A2,2 0 0,0 8,23H19A2,2 0 0,0 21,21V7A2,2 0 0,0 19,5M16,1H4A2,2 0 0,0 2,3V17H4V3H16V1Z"></path></svg><svg viewBox="0 0 24 24" class="copyButtonSuccessIcon_IiZV"><path fill="currentColor" d="M21,7L9,19L3.5,13.5L4.91,12.09L9,16.17L19.59,5.59L21,7Z"></path></svg></span></button></div></div></div></code></pre>
<p>This will show you the 75th percentile LCP score for each page.</p>
<p><img loading="lazy" src="https://www.debugbear.com/dimg/a98080bb27da808f3e210f217109ff01.png" alt="LCP subpart breakdown" style="border-radius:4px" data-abc="true" class="img_CujE"></p>
<p>To view INP subparts and see what element was responsible for a slow interaction, you can use this query:</p>
<pre tabindex="0" class="codeBlockStandalone_Nhx8 thin-scrollbar codeBlockContainer_aalF theme-code-block" style="--prism-color:#bfc7d5;--prism-background-color:#292d3e"><code class="codeBlockLines_RjmQ"><div class="codeBlockContainer_aalF theme-code-block" style="--prism-color:#bfc7d5;--prism-background-color:#292d3e"><div class="codeBlockContent_MHx8"><pre tabindex="0" class="prism-code language-text codeBlock_zHgq thin-scrollbar" style="color:#bfc7d5;background-color:#292d3e"><code class="codeBlockLines_RjmQ"><span class="token-line" style="color:#bfc7d5"><span class="token plain">fetch user.events</span><br></span><span class="token-line" style="color:#bfc7d5"><span class="token plain">| filter characteristics.has_page_summary == true</span><br></span><span class="token-line" style="color:#bfc7d5"><span class="token plain">| filter inp.status == "reported"</span><br></span><span class="token-line" style="color:#bfc7d5"><span class="token plain">| fieldsAdd</span><br></span><span class="token-line" style="color:#bfc7d5"><span class="token plain">    input_delay         = inp.processing_start - inp.start_time,</span><br></span><span class="token-line" style="color:#bfc7d5"><span class="token plain">    processing_time     = inp.processing_end - inp.processing_start,</span><br></span><span class="token-line" style="color:#bfc7d5"><span class="token plain">    presentation_delay  = inp.duration</span><br></span><span class="token-line" style="color:#bfc7d5"><span class="token plain">                        - (inp.processing_end - inp.processing_start)</span><br></span><span class="token-line" style="color:#bfc7d5"><span class="token plain">                        - (inp.processing_start - inp.start_time)</span><br></span><span class="token-line" style="color:#bfc7d5"><span class="token plain">| summarize</span><br></span><span class="token-line" style="color:#bfc7d5"><span class="token plain">    INP_p75               = percentile(inp.duration, 75),</span><br></span><span class="token-line" style="color:#bfc7d5"><span class="token plain">    InputDelay_p75        = percentile(input_delay, 75),</span><br></span><span class="token-line" style="color:#bfc7d5"><span class="token plain">    ProcessingTime_p75    = percentile(processing_time, 75),</span><br></span><span class="token-line" style="color:#bfc7d5"><span class="token plain">    PresentationDelay_p75 = percentile(presentation_delay, 75),</span><br></span><span class="token-line" style="color:#bfc7d5"><span class="token plain">    interactions          = count(),</span><br></span><span class="token-line" style="color:#bfc7d5"><span class="token plain">    by: { inp.ui_element.tag_name, inp.ui_element.xpath }</span><br></span><span class="token-line" style="color:#bfc7d5"><span class="token plain">| sort INP_p75 desc</span><br></span></code></pre><div class="buttonGroup_Sd8_"><button type="button" aria-label="Copy code to clipboard" title="Copy" class="clean-btn"><span class="copyButtonIcons_LnQD" aria-hidden="true"><svg viewBox="0 0 24 24" class="copyButtonIcon_t3l1"><path fill="currentColor" d="M19,21H8V7H19M19,5H8A2,2 0 0,0 6,7V21A2,2 0 0,0 8,23H19A2,2 0 0,0 21,21V7A2,2 0 0,0 19,5M16,1H4A2,2 0 0,0 2,3V17H4V3H16V1Z"></path></svg><svg viewBox="0 0 24 24" class="copyButtonSuccessIcon_IiZV"><path fill="currentColor" d="M21,7L9,19L3.5,13.5L4.91,12.09L9,16.17L19.59,5.59L21,7Z"></path></svg></span></button></div></div></div></code></pre>
<p><img loading="lazy" src="https://www.debugbear.com/dimg/81ecbaf3b16d6a39ef9a0bb8941a112a.png" alt="INP element and subpart breakdown" style="border-radius:4px" data-abc="true" class="img_CujE"></p>
<h2 class="anchor anchorWithStickyNavbar_FNw8" id="website-error-monitoring-with-dynatrace">Website error monitoring with Dynatrace<a href="https://www.debugbear.com/software/dynatrace-real-user-monitoring#website-error-monitoring-with-dynatrace" class="hash-link" aria-label="Direct link to Website error monitoring with Dynatrace" title="Direct link to Website error monitoring with Dynatrace">​</a></h2>
<p>In addition to tracking performance metrics, Dynatrace also collects page errors like JavaScript exceptions or failed network requests.</p>
<p>You can debug each error in detail to see how often it happens, what page it occurs on, or which browsers or operating systems are impacted.</p>
<p><img loading="lazy" src="https://www.debugbear.com/dimg/66888bad0ac896e79baf0ac28c44dd23.png" alt="Dynatrace page error reporting" style="border-radius:4px" data-abc="true" class="img_CujE"></p>
<h2 class="anchor anchorWithStickyNavbar_FNw8" id="making-core-web-vitals-analysis-easy">Making Core Web Vitals analysis easy<a href="https://www.debugbear.com/software/dynatrace-real-user-monitoring#making-core-web-vitals-analysis-easy" class="hash-link" aria-label="Direct link to Making Core Web Vitals analysis easy" title="Direct link to Making Core Web Vitals analysis easy">​</a></h2>
<p>Dynatrace RUM provides a real user monitoring solution that's tightly integrated with their overall observability platform. You can track Core Web Vitals metrics and identify network requests that are slowing down your website.</p>
<p>However, it can sometimes be difficult to find the data you need. And, if you have trouble with INP scores, Dynatrace does not report data on <a href="https://www.debugbear.com/blog/long-animation-frames">Long Animation Frames</a> that can tell you what scripts are delaying interactions.</p>
<p>If Core Web Vitals optimization is a priority for you, consider a specialized web performance tool like <a href="https://www.debugbear.com/">DebugBear</a>.</p>
<p>You can easily get an overview of your overall website performance and identify specific pages that are having problems. From there you can deep-dive into specific performance metrics to see what's causing poor scores.</p>
<p><img loading="lazy" src="https://www.debugbear.com/dimg/01a83c5829bac52da2607f3883765417.png" alt="Core Web Vitals overview dashboard" style="border-radius:4px" data-abc="true" class="img_CujE"></p>
<p>For example, for the INP metric, DebugBear shows a breakdown into different components and highlights specific scripts that run during an interaction, slowing it down.</p>
<p>You can also see how often experiences are delayed when interacting with different page elements.</p>
<p><img loading="lazy" src="https://www.debugbear.com/dimg/c09639eeaf0d91c975cb9fdbc053ba99.png" alt="INP debug data" style="border-radius:4px" data-abc="true" class="img_CujE"></p>
<p>Review specific page views to view in-depth details on the user's device (like browser, screen size, and the amount of device memory available).</p>
<p>You can also see when the user interacted with a specific page element. Where possible, the element is highlighted in a screenshot.</p>
<p>Different scripts run during different phases of handling the interaction, and contribute to the overall INP score.</p>
<p><img loading="lazy" src="https://www.debugbear.com/dimg/1a37a2302a2d3a9e04c0fca77fcb447e.png" alt="INP scripts in DebugBear" style="border-radius:4px" data-abc="true" class="img_CujE"></p>
<p>The request waterfall highlights key network requests that impacted performance, as well as other factors affecting load time:</p>
<ul>
<li>What request was required to load the LCP image?</li>
<li>Did slow CPU tasks impact page speed?</li>
<li>When did the First Contentful Paint and Largest Contentful Paint occur?</li>
</ul>
<p><img loading="lazy" src="https://www.debugbear.com/dimg/6c080951f2fb0edb8ea0a34c20f38e3b.png" alt="RUM request waterfall" style="border-radius:4px" data-abc="true" class="img_CujE"></p>
<p>DebugBear also supports a number of other features, like conversion tracking, advanced alert criteria, and visitor segmentation.</p>
<p>You can also combine RUM metrics with synthetic tests and Google CrUX data, for comprehensive web performance coverage. <a href="https://www.debugbear.com/signup">Sign up for a free trial</a>.</p>
<!-- -->
<div class="cta_Vy7l"><div class="ctaContainer_dzq8"><div class="ctaImage_MZ5b"><img src="https://www.debugbear.com/dimg/57001785e35454b95f43aa4f3bf6f857.png" alt="Illustration of website monitoring" class="themedComponent_mlkZ themedComponent--light_NVdE"><img src="https://www.debugbear.com/dimg/b2c0ae7a8dfbc4b18ba827a334c5c1af.png" alt="Illustration of website monitoring" class="themedComponent_mlkZ themedComponent--dark_xIcU"></div><div class="ctaContent_VgWi"><h2>Monitor Page Speed &amp; Core Web Vitals</h2><div class="ctaBenefits_OYw7"><h3>DebugBear monitoring includes:</h3><ul><li>In-depth Page Speed Reports</li><li>Automated Recommendations</li><li>Real User Analytics Data</li></ul></div><div><a href="https://www.debugbear.com/signup" class="ctaButton_Uos9 hidden-when-logged-in"><span>Start Free Trial</span></a><a href="https://www.debugbear.com/app" class="ctaButton_Uos9 visible-when-logged-in"><span>Go To App</span></a></div></div></div></div>]]></content>
        <author>
            <name>Matt Zeunert</name>
        </author>
    </entry>
    <entry>
        <title type="html"><![CDATA[Frontend Observability Tools: Stay On Top Of User Experience]]></title>
        <id>https://www.debugbear.com/software/frontend-observability-tools</id>
        <link href="https://www.debugbear.com/software/frontend-observability-tools"/>
        <updated>2025-12-14T00:00:00.000Z</updated>
        <summary type="html"><![CDATA[Learn about frontend observability tools that help you monitor performance, track errors, and analyze user experience on your website.]]></summary>
        <content type="html"><![CDATA[<p>Frontend observability tools help you monitor and analyze the performance, reliability, and user experience of your website.</p>
<p>Learn how different monitoring tools can help you optimize your website and deliver a great experience to visitors.</p>
<h2 class="anchor anchorWithStickyNavbar_FNw8" id="debugbear">DebugBear<a href="https://www.debugbear.com/software/frontend-observability-tools#debugbear" class="hash-link" aria-label="Direct link to DebugBear" title="Direct link to DebugBear">​</a></h2>
<p>DebugBear's <a href="https://www.debugbear.com/real-user-monitoring">real user monitoring</a> product can measure frontend performance, track errors, and provide insight into user behavior.</p>
<p>For example, you get a detailed dashboard for tracking Google's <a href="https://www.debugbear.com/docs/metrics/core-web-vitals">Core Web Vitals</a> metrics, which analyze page load time, responsiveness to user interactions, and visual stability.</p>
<p><img loading="lazy" src="https://www.debugbear.com/dimg/882f01b94b8e56a114535630ed8275b5.png" alt="Core Web Vitals observability dashboard" style="border-radius:4px" data-abc="true" class="img_CujE"></p>
<p>You can also inspect specific page views to learn more about the visitor and their experience. For example, you can see:</p>
<ul>
<li>Basic info like browser, country, or operating system</li>
<li>Network bandwidth and latency</li>
<li>Device characteristics like memory and CPU count</li>
<li>The type of navigation (for example, a page reload or back/forward navigation)</li>
</ul>
<p><img loading="lazy" src="https://www.debugbear.com/dimg/afa2fb86aa4569d28915889bc398fc30.png" alt="Page view details" style="border-radius:4px" data-abc="true" class="img_CujE"></p>
<p>DebugBear shows additional details for each performance metric and breaks the metric down into different components.</p>
<p>For example, for the Largest Contentful Paint metric you can see <a href="https://www.debugbear.com/blog/lcp-subparts">LCP subparts</a>, what <a href="https://www.debugbear.com/docs/rum/long-main-thread-tasks">scripts delayed rendering</a>, and what page element was responsible for the largest paint.</p>
<p>The <a href="https://www.debugbear.com/docs/waterfall">request waterfall</a> shows you when different page resources were loaded.</p>
<p><img loading="lazy" src="https://www.debugbear.com/dimg/42791c74f458242e0c5db5978c78c580.png" alt="RUM request waterfall" style="border-radius:4px" data-abc="true" class="img_CujE"></p>
<p>You can debug poor Interaction to Next Paint scores by checking when specific scripts ran during the interaction.</p>
<p>In this screenshot we see a <a href="https://www.debugbear.com/blog/requestanimationframe"><code>requestAnimationFrame</code></a> call that causes a large amount of presentation delay.</p>
<p><img loading="lazy" src="https://www.debugbear.com/dimg/b99fe9c36df6e15f7c65540ac8aa39fa.png" alt="INP script breakdown" style="border-radius:4px" data-abc="true" class="img_CujE"></p>
<p>Check what errors are impacting users on your site. DebugBear lets you see how often different errors occur and what pages are affected.</p>
<p><img loading="lazy" src="https://www.debugbear.com/dimg/98cf037dc8628a39848b16ba9859d65d.png" alt="Frontend error analytics" style="border-radius:4px" data-abc="true" class="img_CujE"></p>
<p>You can also track user sessions to see how visitors navigate across your site.</p>
<p><a href="https://www.debugbear.com/docs/rum/conversion-tracking">Conversion tracking</a> lets you see how page speed and other UX metrics impact business outcomes.</p>
<p><img loading="lazy" src="https://www.debugbear.com/dimg/7b5e015487e6e2b5848cf17f8ce91f55.png" alt="DebugBear conversion tracking" style="border-radius:4px" data-abc="true" class="img_CujE"></p>
<h2 class="anchor anchorWithStickyNavbar_FNw8" id="sentry">Sentry<a href="https://www.debugbear.com/software/frontend-observability-tools#sentry" class="hash-link" aria-label="Direct link to Sentry" title="Direct link to Sentry">​</a></h2>
<p><a href="https://sentry.io/" target="_blank" rel="noopener noreferrer">Sentry</a> is an application monitoring platform that offers error tracking and performance monitoring. It's built to help developers identify and fix issues in their applications.</p>
<p>Sentry offers a number of framework-specific integrations for frontend observability, including support for React, Angular, Vue.js, and more.</p>
<p>You can see how often different errors occur, when each error was first introduced, and when it was last seen.</p>
<p><img loading="lazy" src="https://www.debugbear.com/dimg/4ce6b12f9a4de6edb43c0f0234c3505e.png" alt="Sentry error tracking" style="border-radius:4px" data-abc="true" class="img_CujE"></p>
<p>It also surfaces Google's Core Web Vitals metrics to help you analyze website performance and identify what's causing poor user experiences.</p>
<p><img loading="lazy" src="https://www.debugbear.com/dimg/c52ea8828edd732f3bfc499df6fb98be.png" alt="Sentry web vitals dashboard" style="border-radius:4px" data-abc="true" class="img_CujE"></p>
<p>You can set up alerts in Sentry to get notified about new errors or performance issues.</p>
<p>Sentry also lets you replay specific visitor sessions to see how they interacted with your site and what issues they encountered.</p>
<p><img loading="lazy" src="https://www.debugbear.com/dimg/88a61a54eb5183c14b2531bc7cc5ac21.png" alt="Sentry session replay" style="border-radius:4px" data-abc="true" class="img_CujE"></p>
<h2 class="anchor anchorWithStickyNavbar_FNw8" id="rollbar">Rollbar<a href="https://www.debugbear.com/software/frontend-observability-tools#rollbar" class="hash-link" aria-label="Direct link to Rollbar" title="Direct link to Rollbar">​</a></h2>
<p><a href="https://rollbar.com/" target="_blank" rel="noopener noreferrer">Rollbar</a> is a dedicated error monitoring solution, covering frontend and backend errors. It integrates with your release process and lets you upload source maps for more readable error stack traces.</p>
<p><img loading="lazy" src="https://www.debugbear.com/dimg/68f279418222ac7bd0778dc210260254.png" alt="Rollbar error monitoring" style="border-radius:4px" data-abc="true" class="img_CujE"></p>
<p>You can also send additional debug data to Rollbar to help diagnose issues, for example user actions or custom metadata. Rollbar collects console output to help you understand what might have led to a page error.</p>
<p>It also offers a session replay feature that lets you see how visitors interact with content on your website.</p>
<h2 class="anchor anchorWithStickyNavbar_FNw8" id="datadog">DataDog<a href="https://www.debugbear.com/software/frontend-observability-tools#datadog" class="hash-link" aria-label="Direct link to DataDog" title="Direct link to DataDog">​</a></h2>
<p><a href="https://www.datadoghq.com/" target="_blank" rel="noopener noreferrer">DataDog</a> is a comprehensive IT observability platform that includes frontend monitoring capabilities along with backend tracing, infrastructure monitoring, log management, and more.</p>
<p>It provides real user monitoring as part of its <a href="https://www.debugbear.com/software/digital-experience-monitoring">digital experience monitoring</a> feature set.</p>
<p>DataDog provides detailed reporting for frontend JavaScript errors and lets you see if specific visitor segments are more impacted by specific issues.</p>
<p><img loading="lazy" src="https://www.debugbear.com/dimg/38883719dd31c8e11df7bf82ecc6dd8e.png" alt="DataDog error reporting" style="border-radius:4px" data-abc="true" class="img_CujE"></p>
<p>You can inspect individual visitor sessions in detail and see how certain network requests impacted overall page load time.</p>
<h2 class="anchor anchorWithStickyNavbar_FNw8" id="signoz">SigNoz<a href="https://www.debugbear.com/software/frontend-observability-tools#signoz" class="hash-link" aria-label="Direct link to SigNoz" title="Direct link to SigNoz">​</a></h2>
<p><a href="https://signoz.io/" target="_blank" rel="noopener noreferrer">SigNoz</a> is an open-source observability platform based on OpenTelemetry. It provides a foundation for comprehensive frontend and backend monitoring.</p>
<p>You can report metrics or trace data to SigNoz and analyze it in-depth with flexible analytics dashboards.</p>
<p><img loading="lazy" src="https://www.debugbear.com/dimg/e8494cbe4f78dc4f488ab40c5e0b8eb5.png" alt="SigNoz custom monitoring chart" style="border-radius:4px" data-abc="true" class="img_CujE"></p>
<h2 class="anchor anchorWithStickyNavbar_FNw8" id="what-is-frontend-observability">What is frontend observability?<a href="https://www.debugbear.com/software/frontend-observability-tools#what-is-frontend-observability" class="hash-link" aria-label="Direct link to What is frontend observability?" title="Direct link to What is frontend observability?">​</a></h2>
<p>Frontend observability tools help you get insights into issues impacting your visitors. They also provide detailed debug data to help developers understand what's causing problems and how to fix them.</p>
<p>Common observability features include:</p>
<ul>
<li>Core Web Vitals monitoring</li>
<li>JavaScript error tracking</li>
<li>Session replay</li>
<li>Performance tracing</li>
<li>User behavior analytics</li>
</ul>
<h2 class="anchor anchorWithStickyNavbar_FNw8" id="monitoring-vs-observability">Monitoring vs. observability<a href="https://www.debugbear.com/software/frontend-observability-tools#monitoring-vs-observability" class="hash-link" aria-label="Direct link to Monitoring vs. observability" title="Direct link to Monitoring vs. observability">​</a></h2>
<p>The key to a good observability solution is that it provides in-depth reporting built to help you fix problems quickly. In contrast, monitoring tools often focus on alerting and high-level metric tracking.</p>
<p>Observability tools collect more detailed data and guide you through the debugging process.</p>
<h2 class="anchor anchorWithStickyNavbar_FNw8" id="fix-front-end-performance-and-ux-on-your-website">Fix front-end performance and UX on your website<a href="https://www.debugbear.com/software/frontend-observability-tools#fix-front-end-performance-and-ux-on-your-website" class="hash-link" aria-label="Direct link to Fix front-end performance and UX on your website" title="Direct link to Fix front-end performance and UX on your website">​</a></h2>
<p><a href="https://www.debugbear.com/">DebugBear</a> is a frontend observability service that helps you monitor and improve your website's performance and user experience.</p>
<p>It combines real user monitoring with detailed <a href="https://www.debugbear.com/synthetic-website-monitoring">synthetic</a> tests to help you identify and fix issues before they impact your users. <a href="https://www.debugbear.com/signup">Sign up for a free trial</a>.</p>
<p><img loading="lazy" src="https://www.debugbear.com/dimg/62f65370c56d342cf9a82e275629a30c.png" alt="DebugBear synthetic monitoring dashboard" style="border-radius:4px" data-abc="true" class="img_CujE"></p>
<!-- -->
<div class="cta_Vy7l"><div class="ctaContainer_dzq8"><div class="ctaImage_MZ5b"><img src="https://www.debugbear.com/dimg/57001785e35454b95f43aa4f3bf6f857.png" alt="Illustration of website monitoring" class="themedComponent_mlkZ themedComponent--light_NVdE"><img src="https://www.debugbear.com/dimg/b2c0ae7a8dfbc4b18ba827a334c5c1af.png" alt="Illustration of website monitoring" class="themedComponent_mlkZ themedComponent--dark_xIcU"></div><div class="ctaContent_VgWi"><h2>Monitor Page Speed &amp; Core Web Vitals</h2><div class="ctaBenefits_OYw7"><h3>DebugBear monitoring includes:</h3><ul><li>In-depth Page Speed Reports</li><li>Automated Recommendations</li><li>Real User Analytics Data</li></ul></div><div><a href="https://www.debugbear.com/signup" class="ctaButton_Uos9 hidden-when-logged-in"><span>Start Free Trial</span></a><a href="https://www.debugbear.com/app" class="ctaButton_Uos9 visible-when-logged-in"><span>Go To App</span></a></div></div></div></div>]]></content>
        <author>
            <name>Matt Zeunert</name>
        </author>
    </entry>
    <entry>
        <title type="html"><![CDATA[A Guide To Dynatrace Synthetic Monitoring]]></title>
        <id>https://www.debugbear.com/software/dynatrace-synthetic-monitoring</id>
        <link href="https://www.debugbear.com/software/dynatrace-synthetic-monitoring"/>
        <updated>2025-12-13T00:00:00.000Z</updated>
        <summary type="html"><![CDATA[Learn how to set up synthetic monitoring in Dynatrace to track website performance, availability, and user flows with scheduled browser tests.]]></summary>
        <content type="html"><![CDATA[<p>Dynatrace is a comprehensive observability platform that includes synthetic monitoring capabilities. This guide explains how to set up and use Dynatrace synthetic monitoring to track your website performance and availability.</p>
<h2 class="anchor anchorWithStickyNavbar_FNw8" id="what-are-synthetic-monitors-on-dynatrace">What are synthetic monitors on Dynatrace?<a href="https://www.debugbear.com/software/dynatrace-synthetic-monitoring#what-are-synthetic-monitors-on-dynatrace" class="hash-link" aria-label="Direct link to What are synthetic monitors on Dynatrace?" title="Direct link to What are synthetic monitors on Dynatrace?">​</a></h2>
<p><a href="https://www.debugbear.com/docs/synthetic-website-monitoring">Synthetic website monitoring</a> means running scheduled tests in a controlled test environment. You can specify what page to test, what device to test on, or how fast the network should be.</p>
<p>Your monitoring data will then show how your website performance changes over time, check your website is loading correctly, and make sure you get alerted when there's a problem.</p>
<p><img loading="lazy" src="https://www.debugbear.com/dimg/6590d4fcc555de69e8c0672547942ec1.png" alt="Dynatrace monitoring dashboard" style="border-radius:4px" data-abc="true" class="img_CujE"></p>
<p>Dynatrace supports different types of synthetic monitors:</p>
<ul>
<li>Browser: Monitor the full page load of a website, or track user flow performance</li>
<li>HTTP: Check specific URLs or API endpoints</li>
<li>Network availability: Check ICMP, TCP, or DNS endpoints</li>
</ul>
<p>Synthetic monitoring forms part of a more comprehensive <a href="https://www.debugbear.com/software/digital-experience-monitoring">digital experience monitoring</a> strategy.</p>
<div class="theme-admonition theme-admonition-tip admonition_LMjb alert alert--success"><div class="admonitionHeading_GGQ4"><span class="admonitionIcon_ifdW"><svg viewBox="0 0 12 16"><path fill-rule="evenodd" d="M6.5 0C3.48 0 1 2.19 1 5c0 .92.55 2.25 1 3 1.34 2.25 1.78 2.78 2 4v1h5v-1c.22-1.22.66-1.75 2-4 .45-.75 1-2.08 1-3 0-2.81-2.48-5-5.5-5zm3.64 7.48c-.25.44-.47.8-.67 1.11-.86 1.41-1.25 2.06-1.45 3.23-.02.05-.02.11-.02.17H5c0-.06 0-.13-.02-.17-.2-1.17-.59-1.83-1.45-3.23-.2-.31-.42-.67-.67-1.11C2.44 6.78 2 5.65 2 5c0-2.2 2.02-4 4.5-4 1.22 0 2.36.42 3.22 1.19C10.55 2.94 11 3.94 11 5c0 .66-.44 1.78-.86 2.48zM4 14h5c-.23 1.14-1.3 2-2.5 2s-2.27-.86-2.5-2z"></path></svg></span>tip</div><div class="admonitionContent_pGk6"><p>Try <a href="https://www.debugbear.com/">DebugBear</a> if you're looking for a synthetic monitoring tool that's more focused on end user experience.</p><p><img loading="lazy" src="https://www.debugbear.com/dimg/8fd89980b4f0a50d6199ed9838c44766.png" alt="DebugBear synthetic monitoring dashboard" style="border-radius:4px" data-abc="true" class="img_CujE"></p></div></div>
<h2 class="anchor anchorWithStickyNavbar_FNw8" id="how-to-set-up-a-synthetic-monitor-on-dynatrace">How to set up a synthetic monitor on Dynatrace<a href="https://www.debugbear.com/software/dynatrace-synthetic-monitoring#how-to-set-up-a-synthetic-monitor-on-dynatrace" class="hash-link" aria-label="Direct link to How to set up a synthetic monitor on Dynatrace" title="Direct link to How to set up a synthetic monitor on Dynatrace">​</a></h2>
<p>To start setting up a synthetic monitor, first select <strong>Apps</strong>, look for the <strong>Digital Experience</strong> section, and then click on <strong>Synthetic</strong>.</p>
<p><img loading="lazy" src="https://www.debugbear.com/dimg/8ad525c678fbe55cea71460e496005e3.png" alt="Create a synthetic monitor in Dynatrace" style="border-radius:4px" data-abc="true" class="img_CujE"></p>
<p>Next you need to select the type of monitor.</p>
<p>We'll pick a Browser monitor that will open the whole web page in the browser and provide insights on how the website is loading and if there were any errors.</p>
<p><img loading="lazy" src="https://www.debugbear.com/dimg/5050b7d589b1ddae49a9647c217b739b.png" alt="Setting up a Browser monitor" style="border-radius:4px" data-abc="true" class="img_CujE"></p>
<p>Now we've arrived at the first of 6 setup steps. Here we assign a name for the monitor and specify the device profile, bandwidth profile, and user agent.</p>
<p>Under the device profile we can select a predefined device size, for example an iPad Air. We can also manually specify the screen height and width.</p>
<p>We can also throttle the network and specify a specific download and upload speed. The network latency option introduces additional <a href="https://www.debugbear.com/blog/network-round-trip-time-latency">round trip time</a> between the client and the server.</p>
<p><img loading="lazy" src="https://www.debugbear.com/dimg/da05deda2ce65bb1a169c4636844c1d7.png" alt="Monitor name and device configuration" style="border-radius:4px" data-abc="true" class="img_CujE"></p>
<p>Next you need to set up the monitor steps. That can be either a visit to a single URL or a more complex <a href="https://www.debugbear.com/docs/synthetic-transaction-monitoring">synthetic transaction flow</a>.</p>
<p>For now we'll just go with a simple URL test.</p>
<p><img loading="lazy" src="https://www.debugbear.com/dimg/76307230872121a21c79b71f6ab2a8d8.png" alt="Monitor steps setup" style="border-radius:4px" data-abc="true" class="img_CujE"></p>
<p>You can specify a test frequency between every 5 minutes and every 4 hours. Alternatively, you can configure the monitor to only run tests on demand.</p>
<p>Dynatrace lets you run synthetic tests from a large number of different test locations. Where a test is run from will impact page load speed and can also impact uptime and errors if page content depends on the visitor location.</p>
<div class="theme-admonition theme-admonition-tip admonition_LMjb alert alert--success"><div class="admonitionHeading_GGQ4"><span class="admonitionIcon_ifdW"><svg viewBox="0 0 12 16"><path fill-rule="evenodd" d="M6.5 0C3.48 0 1 2.19 1 5c0 .92.55 2.25 1 3 1.34 2.25 1.78 2.78 2 4v1h5v-1c.22-1.22.66-1.75 2-4 .45-.75 1-2.08 1-3 0-2.81-2.48-5-5.5-5zm3.64 7.48c-.25.44-.47.8-.67 1.11-.86 1.41-1.25 2.06-1.45 3.23-.02.05-.02.11-.02.17H5c0-.06 0-.13-.02-.17-.2-1.17-.59-1.83-1.45-3.23-.2-.31-.42-.67-.67-1.11C2.44 6.78 2 5.65 2 5c0-2.2 2.02-4 4.5-4 1.22 0 2.36.42 3.22 1.19C10.55 2.94 11 3.94 11 5c0 .66-.44 1.78-.86 2.48zM4 14h5c-.23 1.14-1.3 2-2.5 2s-2.27-.86-2.5-2z"></path></svg></span>tip</div><div class="admonitionContent_pGk6"><p>You may need to set up your network so that Dynatrace synthetic checks are not blocked accidentally. When selecting a monitoring location Dynatrace provides a list of IP addresses that requests are made from.</p></div></div>
<p><img loading="lazy" src="https://www.debugbear.com/dimg/fc240cbbc38241e72730ac8498eb2935.png" alt="Dynatrace monitoring location" style="border-radius:4px" data-abc="true" class="img_CujE"></p>
<p>When an outage is detected, Dynatrace can trigger an alert to ensure you're notified.</p>
<p>To avoid unnecessary alert noise you can configure this to only trigger when the test fails several times consecutively.</p>
<p><img loading="lazy" src="https://www.debugbear.com/dimg/d9f3bc4724ec2aaa6ffd5cbe6b76295a.png" alt="Outage and performance settings in Dynatrace" style="border-radius:4px" data-abc="true" class="img_CujE"></p>
<p>The advanced setup options let you set cookies, block specific requests, or run JavaScript on the page.</p>
<p>You can also pass in additional HTTP headers or make requests through a proxy.</p>
<p><img loading="lazy" src="https://www.debugbear.com/dimg/ca3a35a8f706f62e2344ebd9ea21ed2a.png" alt="Dynatrace synthetics advanced settings" style="border-radius:4px" data-abc="true" class="img_CujE"></p>
<p>Finally, the Summary step provides an overview of the options you've selected.</p>
<p>Click "Save" to complete the monitoring setup.</p>
<p><img loading="lazy" src="https://www.debugbear.com/dimg/5d92147d43859ee237eb9bd00d82d45d.png" alt="Synthetic monitor summary" style="border-radius:4px" data-abc="true" class="img_CujE"></p>
<h2 class="anchor anchorWithStickyNavbar_FNw8" id="viewing-synthetic-test-result-data">Viewing synthetic test result data<a href="https://www.debugbear.com/software/dynatrace-synthetic-monitoring#viewing-synthetic-test-result-data" class="hash-link" aria-label="Direct link to Viewing synthetic test result data" title="Direct link to Viewing synthetic test result data">​</a></h2>
<p>Once the monitor is set up you'll quickly start to see data coming in.</p>
<p>Dynatrace shows you whether the monitor ran successfully and how long the test took to run.</p>
<p><img loading="lazy" src="https://www.debugbear.com/dimg/894df50396ab393edb273a672c653825.png" alt="Dynatrace synthetic monitor view" style="border-radius:4px" data-abc="true" class="img_CujE"></p>
<p>Click on "View details" to see availability and performance tracked over time.</p>
<p>You can see whether the test duration changed over time, how much downtime your website had, and whether outages impacted all test locations.</p>
<p><img loading="lazy" src="https://www.debugbear.com/dimg/4afcbf5735641f69ee4ca01185b6e2d3.png" alt="Synthetic monitor trend" style="border-radius:4px" data-abc="true" class="img_CujE"></p>
<div class="theme-admonition theme-admonition-tip admonition_LMjb alert alert--success"><div class="admonitionHeading_GGQ4"><span class="admonitionIcon_ifdW"><svg viewBox="0 0 12 16"><path fill-rule="evenodd" d="M6.5 0C3.48 0 1 2.19 1 5c0 .92.55 2.25 1 3 1.34 2.25 1.78 2.78 2 4v1h5v-1c.22-1.22.66-1.75 2-4 .45-.75 1-2.08 1-3 0-2.81-2.48-5-5.5-5zm3.64 7.48c-.25.44-.47.8-.67 1.11-.86 1.41-1.25 2.06-1.45 3.23-.02.05-.02.11-.02.17H5c0-.06 0-.13-.02-.17-.2-1.17-.59-1.83-1.45-3.23-.2-.31-.42-.67-.67-1.11C2.44 6.78 2 5.65 2 5c0-2.2 2.02-4 4.5-4 1.22 0 2.36.42 3.22 1.19C10.55 2.94 11 3.94 11 5c0 .66-.44 1.78-.86 2.48zM4 14h5c-.23 1.14-1.3 2-2.5 2s-2.27-.86-2.5-2z"></path></svg></span>tip</div><div class="admonitionContent_pGk6"><p>DebugBear <a href="https://www.debugbear.com/synthetic-website-monitoring">synthetic monitoring</a> can quickly surface key metrics that impact visitor experience.</p><p><img loading="lazy" src="https://www.debugbear.com/dimg/859fd56e684ccf11fbfc85955f247a6b.png" alt="DebugBear synthetic monitoring dashboard" style="border-radius:4px" data-abc="true" class="img_CujE"></p></div></div>
<h3 class="anchor anchorWithStickyNavbar_FNw8" id="analyze-executions">Analyze executions<a href="https://www.debugbear.com/software/dynatrace-synthetic-monitoring#analyze-executions" class="hash-link" aria-label="Direct link to Analyze executions" title="Direct link to Analyze executions">​</a></h3>
<p>To get more details on each test result, click on "Analyze executions".</p>
<p>You can see the execution time of each monitor, as well as important metrics like the <a href="https://www.debugbear.com/docs/metrics/largest-contentful-paint">Largest Contentful Paint</a>.</p>
<p><img loading="lazy" src="https://www.debugbear.com/dimg/de9cee5d87e24fbb6eb66d05df8e12c4.png" alt="Dynatrace Largest Contentful Paint data" style="border-radius:4px" data-abc="true" class="img_CujE"></p>
<p>The detailed breakdown view includes a <a href="https://www.debugbear.com/docs/waterfall">request waterfall</a> view that shows all the resources that are loaded on the page.</p>
<p>Hover over each request to see how much time was spent on establishing a <a href="https://www.debugbear.com/blog/http-server-connections">server connection</a> or on downloading the response data.</p>
<p><img loading="lazy" src="https://www.debugbear.com/dimg/d826bf985eddd840d99dbfdee5e95a27.png" alt="Dynatrace waterfall view" style="border-radius:4px" data-abc="true" class="img_CujE"></p>
<p>Dynatrace also identifies specific performance issues like non-optimized images or uncompressed text files. Click on "Show all findings" to see all recommendations.</p>
<div class="theme-admonition theme-admonition-tip admonition_LMjb alert alert--success"><div class="admonitionHeading_GGQ4"><span class="admonitionIcon_ifdW"><svg viewBox="0 0 12 16"><path fill-rule="evenodd" d="M6.5 0C3.48 0 1 2.19 1 5c0 .92.55 2.25 1 3 1.34 2.25 1.78 2.78 2 4v1h5v-1c.22-1.22.66-1.75 2-4 .45-.75 1-2.08 1-3 0-2.81-2.48-5-5.5-5zm3.64 7.48c-.25.44-.47.8-.67 1.11-.86 1.41-1.25 2.06-1.45 3.23-.02.05-.02.11-.02.17H5c0-.06 0-.13-.02-.17-.2-1.17-.59-1.83-1.45-3.23-.2-.31-.42-.67-.67-1.11C2.44 6.78 2 5.65 2 5c0-2.2 2.02-4 4.5-4 1.22 0 2.36.42 3.22 1.19C10.55 2.94 11 3.94 11 5c0 .66-.44 1.78-.86 2.48zM4 14h5c-.23 1.14-1.3 2-2.5 2s-2.27-.86-2.5-2z"></path></svg></span>tip</div><div class="admonitionContent_pGk6"><p>The DebugBear request waterfall is built to make it as easy as possible to identify page speed optimizations.</p><p>You can use our <a href="https://www.debugbear.com/test/website-speed">free website speed test</a> to try it out!</p><p><img loading="lazy" src="https://www.debugbear.com/dimg/7f9f7492d272e241161a4982ea76f6be.png" alt="Synthetic request waterfall" style="border-radius:4px" data-abc="true" class="img_CujE"></p></div></div>
<h2 class="anchor anchorWithStickyNavbar_FNw8" id="trigger-tests-on-demand">Trigger tests on-demand<a href="https://www.debugbear.com/software/dynatrace-synthetic-monitoring#trigger-tests-on-demand" class="hash-link" aria-label="Direct link to Trigger tests on-demand" title="Direct link to Trigger tests on-demand">​</a></h2>
<p>Dynatrace lets you trigger additional on-demand tests for each monitor. Click on "On-demand execution".</p>
<p><img loading="lazy" src="https://www.debugbear.com/dimg/d323ebd58416ab46ce4437cbfada8942.png" alt="On-demand execution" style="border-radius:4px" data-abc="true" class="img_CujE"></p>
<p>You can then configure whether tests will be run in all locations or just in one specific place.</p>
<p>Click on "Trigger now" to start the test.</p>
<p><img loading="lazy" src="https://www.debugbear.com/dimg/4aaef166eab9dcf521f53cf3b435ad6d.png" alt="Configure on-demand execution" style="border-radius:4px" data-abc="true" class="img_CujE"></p>
<h2 class="anchor anchorWithStickyNavbar_FNw8" id="what-are-synthetic-actions-on-dynatrace">What are synthetic actions on Dynatrace?<a href="https://www.debugbear.com/software/dynatrace-synthetic-monitoring#what-are-synthetic-actions-on-dynatrace" class="hash-link" aria-label="Direct link to What are synthetic actions on Dynatrace?" title="Direct link to What are synthetic actions on Dynatrace?">​</a></h2>
<p>Each browser test counts as one synthetic action that you are billed for.</p>
<p>If you run tests every hour that means you'll use 24 actions per day or roughly 2,900 per month.</p>
<h3 class="anchor anchorWithStickyNavbar_FNw8" id="dynatrace-pricing-for-synthetic-testing">Dynatrace pricing for synthetic testing<a href="https://www.debugbear.com/software/dynatrace-synthetic-monitoring#dynatrace-pricing-for-synthetic-testing" class="hash-link" aria-label="Direct link to Dynatrace pricing for synthetic testing" title="Direct link to Dynatrace pricing for synthetic testing">​</a></h3>
<p>Dynatrace charges $4.50 per 1,000 synthetic tests. A single hourly monitor will cost roughly $13 per month.</p>
<h2 class="anchor anchorWithStickyNavbar_FNw8" id="purpose-built-synthetic-web-performance-monitoring">Purpose-built synthetic web performance monitoring<a href="https://www.debugbear.com/software/dynatrace-synthetic-monitoring#purpose-built-synthetic-web-performance-monitoring" class="hash-link" aria-label="Direct link to Purpose-built synthetic web performance monitoring" title="Direct link to Purpose-built synthetic web performance monitoring">​</a></h2>
<p>If your focus is on web performance, try out <a href="https://www.debugbear.com/">DebugBear</a> monitoring to make optimizing your page load time easier and to get the data you need to identify and fix regressions.</p>
<p>DebugBear can alert you when new issues come up and then help you see what broke. For example, here we can see a 36% increase in page weight. When debugging the change we see the specific files that increased in size. Here text compression no longer works correctly, as indicated by the change from Gzip to no compression being applied.</p>
<p><img loading="lazy" src="https://www.debugbear.com/dimg/630dbf7dad6625a924d438c521cc2414.png" alt="Page speed regression data" style="border-radius:4px" data-abc="true" class="img_CujE"></p>
<p>DebugBear also includes more advanced performance recommendations than Dynatrace, helping you find the most important optimizations quickly.</p>
<p>You can also run <a href="https://www.debugbear.com/docs/experiments">experiments</a> to try out fixes to see how they impact your metrics. <a href="https://www.debugbear.com/signup">Sign up for a free trial</a>.</p>
<p><img loading="lazy" src="https://www.debugbear.com/dimg/183cba4d380b3474229f181797e44a6a.png" alt="Page speed recommendations based on synthetic data" style="border-radius:4px" data-abc="true" class="img_CujE"></p>
<!-- -->
<div class="cta_Vy7l"><div class="ctaContainer_dzq8"><div class="ctaImage_MZ5b"><img src="https://www.debugbear.com/dimg/57001785e35454b95f43aa4f3bf6f857.png" alt="Illustration of website monitoring" class="themedComponent_mlkZ themedComponent--light_NVdE"><img src="https://www.debugbear.com/dimg/b2c0ae7a8dfbc4b18ba827a334c5c1af.png" alt="Illustration of website monitoring" class="themedComponent_mlkZ themedComponent--dark_xIcU"></div><div class="ctaContent_VgWi"><h2>Monitor Page Speed &amp; Core Web Vitals</h2><div class="ctaBenefits_OYw7"><h3>DebugBear monitoring includes:</h3><ul><li>In-depth Page Speed Reports</li><li>Automated Recommendations</li><li>Real User Analytics Data</li></ul></div><div><a href="https://www.debugbear.com/signup" class="ctaButton_Uos9 hidden-when-logged-in"><span>Start Free Trial</span></a><a href="https://www.debugbear.com/app" class="ctaButton_Uos9 visible-when-logged-in"><span>Go To App</span></a></div></div></div></div>]]></content>
        <author>
            <name>Matt Zeunert</name>
        </author>
    </entry>
    <entry>
        <title type="html"><![CDATA[Best YSlow Alternatives: Modern Page Speed Testing Tools]]></title>
        <id>https://www.debugbear.com/software/yslow-alternatives</id>
        <link href="https://www.debugbear.com/software/yslow-alternatives"/>
        <updated>2025-12-12T00:00:00.000Z</updated>
        <summary type="html"><![CDATA[YSlow is a site speed testing tool that was first released in 2007. However, today more modern site speed testing tools are available.]]></summary>
        <content type="html"><![CDATA[<p>YSlow is a site speed testing tool that was first released in 2007. It analyzes your website to identify potential performance optimizations.</p>
<p>While YSlow still powers testing services like <a href="https://www.debugbear.com/software/pingdom-speed-test">Pingdom</a> there are more modern alternatives available today. In this article we'll look at some of the free tools you can use to test your website speed today.</p>
<h2 class="anchor anchorWithStickyNavbar_FNw8" id="debugbear-website-speed-test">DebugBear Website Speed Test<a href="https://www.debugbear.com/software/yslow-alternatives#debugbear-website-speed-test" class="hash-link" aria-label="Direct link to DebugBear Website Speed Test" title="Direct link to DebugBear Website Speed Test">​</a></h2>
<p>DebugBear's <a href="https://www.debugbear.com/test/website-speed" target="_blank" rel="noopener noreferrer">website speed test</a> is a free tool that tells you how your website is loading for visitors and what you can do to optimize it.</p>
<p>It shows various page speed metrics, including Google's <a href="https://www.debugbear.com/docs/metrics/core-web-vitals">Core Web Vitals</a> metrics. These are also shown as annotations to the rendering filmstrip, which shows how the page loaded frame by frame.</p>
<p><img loading="lazy" src="https://www.debugbear.com/dimg/3175fb09fcd53372eff95725a9d5606f.png" alt="Page speed test result" style="border-radius:4px" data-abc="true" class="img_CujE"></p>
<p>The test result also includes a number of performance recommendations you can use to <a href="https://www.debugbear.com/blog/improve-website-performance">improve your website speed</a>.</p>
<p>For example, DebugBear identifies when important images are not prioritized correctly or when the HTML document is oversized.</p>
<p><img loading="lazy" src="https://www.debugbear.com/dimg/c386ce7758e4a5b68d980e22893f0894.png" alt="Page speed recommendation" style="border-radius:4px" data-abc="true" class="img_CujE"></p>
<p>The <a href="https://www.debugbear.com/docs/waterfall">request waterfall</a> view shows you when different page resources loaded and how that impacts the visual page load process.</p>
<p>You can also easily view additional information for each request:</p>
<ul>
<li>The request priority and resource size</li>
<li>Whether the request is render-blocking</li>
<li>Whether scripts are deferred</li>
<li>Whether images are lazy loaded</li>
<li>What request is responsible for the main image</li>
</ul>
<p><img loading="lazy" src="https://www.debugbear.com/dimg/b53eef5bafec03455883d05b17a1e611.png" alt="Request waterfall with page speed impact" style="border-radius:4px" data-abc="true" class="img_CujE"></p>
<p>Finally, the Web Vitals tab also provides insights into real visitor experience based on the <a href="https://www.debugbear.com/blog/chrome-user-experience-report">Chrome User Experience Report</a> (CrUX):</p>
<ul>
<li>Is your website passing Google's Core Web Vitals assessment?</li>
<li>How have your scores changed over the last 40 weeks?</li>
<li>How does page load time break down into different components?</li>
<li>Is there room to speed up page reloads or back/forward navigations?</li>
</ul>
<p><img loading="lazy" src="https://www.debugbear.com/dimg/20c7a544f99551093abae898833cfca5.png" alt="DebugBear Core Web Vitals data" style="border-radius:4px" data-abc="true" class="img_CujE"></p>
<p>Overall, the DebugBear page speed test is a modern alternative to YSlow that can give you detailed insights to speed up your website.</p>
<h2 class="anchor anchorWithStickyNavbar_FNw8" id="pagespeed-insights">PageSpeed Insights<a href="https://www.debugbear.com/software/yslow-alternatives#pagespeed-insights" class="hash-link" aria-label="Direct link to PageSpeed Insights" title="Direct link to PageSpeed Insights">​</a></h2>
<p>Google's <a href="https://pagespeed.web.dev/" target="_blank" rel="noopener noreferrer">PageSpeed Insights</a> tool is a great starting point for measuring website performance. Like DebugBear it combines CrUX data with detailed on-demand tests.</p>
<p><img loading="lazy" src="https://www.debugbear.com/dimg/12308999f55518c53fc89a67e7e7ab1d.png" alt="PageSpeed Insights test result" style="border-radius:4px" data-abc="true" class="img_CujE"></p>
<p>PageSpeed Insights assigns your website a <a href="https://www.debugbear.com/docs/metrics/lighthouse-performance">performance score</a> between 0 and 100. This is based on 5 different subscores:</p>
<ul>
<li><a href="https://www.debugbear.com/docs/metrics/largest-contentful-paint">Largest Contentful Paint</a>: When the main page content becomes visible</li>
<li><a href="https://www.debugbear.com/docs/metrics/first-contentful-paint">First Contentful Paint</a>: When the first content appears on the page</li>
<li><a href="https://www.debugbear.com/docs/metrics/speed-index">Speed Index</a>: How quickly content is visually displayed during page load</li>
<li><a href="https://www.debugbear.com/docs/metrics/cumulative-layout-shift">Cumulative Layout Shift</a>: Visual stability, whether content shifts around on the page</li>
<li><a href="https://www.debugbear.com/docs/metrics/total-blocking-time">Total Blocking Time</a>: Measures how long the main thread is blocked from responding to user input</li>
</ul>
<p>On top of checking performance, PageSpeed Insights also reports scores for <a href="https://www.debugbear.com/blog/lighthouse-accessibility">Accessibility</a> and on-page <a href="https://www.debugbear.com/blog/lighthouse-seo-score">SEO</a>.</p>
<p><img loading="lazy" src="https://www.debugbear.com/dimg/938b0257df0ac9bab69da2933ec6fdf3.png" alt="PageSpeed Insights result" style="border-radius:4px" data-abc="true" class="img_CujE"></p>
<p>The performance diagnostics can provide detailed suggestions on what's slowing down your website.</p>
<p>For example, the <a href="https://www.debugbear.com/blog/lcp-request-discovery">LCP request discovery</a> audit tells you whether the browser can quickly start loading the main image that's responsible for the Largest Contentful Paint rendering milestone.</p>
<p><img loading="lazy" src="https://www.debugbear.com/dimg/4032997ab7120fcc21878a544c949064.png" alt="LCP request discovery suggestion on PageSpeed Insights" style="border-radius:4px" data-abc="true" class="img_CujE"></p>
<p>Our <a href="https://www.debugbear.com/blog/pagespeed-insights">detailed guide to using PageSpeed Insights</a> explains how to interpret the metrics reported by Google and how to fix the issues that it highlights.</p>
<div class="theme-admonition theme-admonition-tip admonition_LMjb alert alert--success"><div class="admonitionHeading_GGQ4"><span class="admonitionIcon_ifdW"><svg viewBox="0 0 12 16"><path fill-rule="evenodd" d="M6.5 0C3.48 0 1 2.19 1 5c0 .92.55 2.25 1 3 1.34 2.25 1.78 2.78 2 4v1h5v-1c.22-1.22.66-1.75 2-4 .45-.75 1-2.08 1-3 0-2.81-2.48-5-5.5-5zm3.64 7.48c-.25.44-.47.8-.67 1.11-.86 1.41-1.25 2.06-1.45 3.23-.02.05-.02.11-.02.17H5c0-.06 0-.13-.02-.17-.2-1.17-.59-1.83-1.45-3.23-.2-.31-.42-.67-.67-1.11C2.44 6.78 2 5.65 2 5c0-2.2 2.02-4 4.5-4 1.22 0 2.36.42 3.22 1.19C10.55 2.94 11 3.94 11 5c0 .66-.44 1.78-.86 2.48zM4 14h5c-.23 1.14-1.3 2-2.5 2s-2.27-.86-2.5-2z"></path></svg></span>tip</div><div class="admonitionContent_pGk6"><p>The performance score data in PageSpeed Insights <a href="https://www.debugbear.com/blog/is-pagespeed-insights-reliable">isn't always reliable</a> due to how the tool estimates performance on slower connections.</p></div></div>
<h2 class="anchor anchorWithStickyNavbar_FNw8" id="chrome-devtools">Chrome DevTools<a href="https://www.debugbear.com/software/yslow-alternatives#chrome-devtools" class="hash-link" aria-label="Direct link to Chrome DevTools" title="Direct link to Chrome DevTools">​</a></h2>
<p>Google's Chrome browser comes with <a href="https://www.debugbear.com/blog/use-chrome-devtools">powerful built-in developer tools</a>. Over the last two years Google has also done a lot of work to improve the performance testing features offered by Chrome.</p>
<p>For example, when you open the <a href="https://www.debugbear.com/blog/devtools-performance">DevTools Performance tab</a> you can now quickly see the Core Web Vitals metrics and start debugging page load time.</p>
<p><img loading="lazy" src="https://www.debugbear.com/dimg/506e11a626d0db354545bf9c65877853.png" alt="Chrome DevTools performance overview" style="border-radius:4px" data-abc="true" class="img_CujE"></p>
<p>The Performance profile is a powerful way to analyze page load delays and slow interactions. The <a href="https://www.debugbear.com/blog/performance-insights-devtools-lighthouse">performance insights</a> help you quickly identify optimizations on the page.</p>
<p>DevTools also provides in-depth insights into CPU processing work and JavaScript execution time. This is especially important for investigating <a href="https://www.debugbear.com/blog/single-page-application-monitoring">single page application performance</a>.</p>
<p><img loading="lazy" src="https://www.debugbear.com/dimg/63aefa70522a5b74a2bffef8fd81cc1f.png" alt="DevTools performance data" style="border-radius:4px" data-abc="true" class="img_CujE"></p>
<p>Other features of Chrome DevTools include:</p>
<ul>
<li><a href="https://www.debugbear.com/blog/chrome-devtools-network-throttling">Throttling the network connection</a></li>
<li><a href="https://www.debugbear.com/blog/chrome-javascript-debugger">Debugging JavaScript code</a></li>
<li><a href="https://www.debugbear.com/blog/chrome-browser-console">Viewing errors and warnings in the browser console</a></li>
<li><a href="https://www.debugbear.com/blog/devtools-network">Inspecting network requests</a></li>
</ul>
<h2 class="anchor anchorWithStickyNavbar_FNw8" id="webpagetest">WebPageTest<a href="https://www.debugbear.com/software/yslow-alternatives#webpagetest" class="hash-link" aria-label="Direct link to WebPageTest" title="Direct link to WebPageTest">​</a></h2>
<p><a href="https://www.webpagetest.org/" target="_blank" rel="noopener noreferrer">WebPageTest</a> has long been an advanced performance testing tool, and it describes itself as the "gold standard in web performance optimization". A key strength of WebPageTest is the technical detail the tool can provide.</p>
<p>WebPageTest shows you key performance metrics and a rendering progress visualization for your website. You also get a detailed request waterfall where you can see how different resources contribute to the page load process.</p>
<p><img loading="lazy" src="https://www.debugbear.com/dimg/e6c4f302b576eb2ad58e797394869237.png" alt="WebPageTest result" style="border-radius:4px" data-abc="true" class="img_CujE"></p>
<p>The connection view shows how different resources share the same <a href="https://www.debugbear.com/blog/http-server-connections">server connections</a>. It also makes it easier to see how network bandwidth is used when transferring different resources.</p>
<p>Here we can see how the browser loads files from different servers, and what network requests can share a connection.</p>
<p><img loading="lazy" src="https://www.debugbear.com/dimg/78a8e05c14f1d0edb695252ed4aa8ddc.png" alt="WebPageTest connection view" style="border-radius:4px" data-abc="true" class="img_CujE"></p>
<div class="theme-admonition theme-admonition-tip admonition_LMjb alert alert--success"><div class="admonitionHeading_GGQ4"><span class="admonitionIcon_ifdW"><svg viewBox="0 0 12 16"><path fill-rule="evenodd" d="M6.5 0C3.48 0 1 2.19 1 5c0 .92.55 2.25 1 3 1.34 2.25 1.78 2.78 2 4v1h5v-1c.22-1.22.66-1.75 2-4 .45-.75 1-2.08 1-3 0-2.81-2.48-5-5.5-5zm3.64 7.48c-.25.44-.47.8-.67 1.11-.86 1.41-1.25 2.06-1.45 3.23-.02.05-.02.11-.02.17H5c0-.06 0-.13-.02-.17-.2-1.17-.59-1.83-1.45-3.23-.2-.31-.42-.67-.67-1.11C2.44 6.78 2 5.65 2 5c0-2.2 2.02-4 4.5-4 1.22 0 2.36.42 3.22 1.19C10.55 2.94 11 3.94 11 5c0 .66-.44 1.78-.86 2.48zM4 14h5c-.23 1.14-1.3 2-2.5 2s-2.27-.86-2.5-2z"></path></svg></span>tip</div><div class="admonitionContent_pGk6"><p>Learn more about <a href="https://www.debugbear.com/software/webpagetest">testing page speed with WebPageTest</a>.</p></div></div>
<h2 class="anchor anchorWithStickyNavbar_FNw8" id="google-lighthouse">Google Lighthouse<a href="https://www.debugbear.com/software/yslow-alternatives#google-lighthouse" class="hash-link" aria-label="Direct link to Google Lighthouse" title="Direct link to Google Lighthouse">​</a></h2>
<p><a href="https://developer.chrome.com/docs/lighthouse/overview" target="_blank" rel="noopener noreferrer">Lighthouse</a> is an open-source library by Google. It's actually integrated into many other tools like PageSpeed Insights, Chrome DevTools, and DebugBear.</p>
<p>You can also run Lighthouse through the command line interface or using Node.js. That lets developers build automated processes for performance testing and analysis.</p>
<p>For example, <a href="https://www.debugbear.com/software/unlighthouse-website-scan">Unlighthouse</a> is a Lighthouse-based tool that can scan your entire website for page speed issues.</p>
<p><img loading="lazy" src="https://www.debugbear.com/dimg/b394af7956a81f8a62a40c472fcab264.png" alt="Lighthouse test result" style="border-radius:4px" data-abc="true" class="img_CujE"></p>
<h2 class="anchor anchorWithStickyNavbar_FNw8" id="crux-vis">CrUX Vis<a href="https://www.debugbear.com/software/yslow-alternatives#crux-vis" class="hash-link" aria-label="Direct link to CrUX Vis" title="Direct link to CrUX Vis">​</a></h2>
<p><a href="https://cruxvis.withgoogle.com/#/" target="_blank" rel="noopener noreferrer">CrUX Vis</a> is a Google tool that exclusively shows data from the Chrome User Experience Report.</p>
<p>It doesn't provide detailed diagnostics but instead focuses on real user experience and historical data.</p>
<p><img loading="lazy" src="https://www.debugbear.com/dimg/4cd29fc02b78e5d5cfc59035203090d9.png" alt="CrUX Vis web vitals trends" style="border-radius:4px" data-abc="true" class="img_CujE"></p>
<h2 class="anchor anchorWithStickyNavbar_FNw8" id="why-is-yslow-outdated">Why is YSlow outdated?<a href="https://www.debugbear.com/software/yslow-alternatives#why-is-yslow-outdated" class="hash-link" aria-label="Direct link to Why is YSlow outdated?" title="Direct link to Why is YSlow outdated?">​</a></h2>
<p>YSlow was an early front-end performance testing tool, but it hasn't been updated in over 10 years. Today more modern alternatives exist that can provide more helpful reporting to help you <a href="https://www.debugbear.com/blog/website-performance-optimization">optimize website performance</a>.</p>
<p>Some of the suggestions that YSlow provides are also outdated today, as new technologies like <a href="https://www.debugbear.com/blog/http1-vs-http2">HTTP/2</a> have become available.</p>
<h2 class="anchor anchorWithStickyNavbar_FNw8" id="run-continuous-page-speed-tests">Run continuous page speed tests<a href="https://www.debugbear.com/software/yslow-alternatives#run-continuous-page-speed-tests" class="hash-link" aria-label="Direct link to Run continuous page speed tests" title="Direct link to Run continuous page speed tests">​</a></h2>
<p>Site speed testing tools are great for getting a snapshot of your performance metrics and to find ways to improve performance. <a href="https://www.debugbear.com/software/best-website-performance-monitoring-tools">Website performance monitoring</a> helps you stay on top of your page speed for the long term.</p>
<p><a href="https://www.debugbear.com/">DebugBear</a> helps you deliver a great visitor experience by providing continuous <a href="https://www.debugbear.com/synthetic-website-monitoring">synthetic website monitoring</a> and <a href="https://www.debugbear.com/real-user-monitoring">real-time visitor analytics</a>.</p>
<p>You can quickly pick up when your page load time changes and compare test results to each other to see what caused the metric regression.</p>
<p><img loading="lazy" src="https://www.debugbear.com/dimg/fe56b335afbe83676c456ed8340f37ba.png" alt="Page speed monitoring" style="border-radius:4px" data-abc="true" class="img_CujE"></p>
<p>Real user monitoring shows you how fast your website really is for visitors. Track Core Web Vitals and other performance metrics over time, and inspect specific page visits to see how you can optimize the visitor experience.</p>
<p><img loading="lazy" src="https://www.debugbear.com/dimg/4371a572c00ca1ffe08a60d811e64918.png" alt="Real user Core Web Vitals monitoring" style="border-radius:4px" data-abc="true" class="img_CujE"></p>
<!-- -->
<div class="cta_Vy7l"><div class="ctaContainer_dzq8"><div class="ctaImage_MZ5b"><img src="https://www.debugbear.com/dimg/57001785e35454b95f43aa4f3bf6f857.png" alt="Illustration of website monitoring" class="themedComponent_mlkZ themedComponent--light_NVdE"><img src="https://www.debugbear.com/dimg/b2c0ae7a8dfbc4b18ba827a334c5c1af.png" alt="Illustration of website monitoring" class="themedComponent_mlkZ themedComponent--dark_xIcU"></div><div class="ctaContent_VgWi"><h2>Monitor Page Speed &amp; Core Web Vitals</h2><div class="ctaBenefits_OYw7"><h3>DebugBear monitoring includes:</h3><ul><li>In-depth Page Speed Reports</li><li>Automated Recommendations</li><li>Real User Analytics Data</li></ul></div><div><a href="https://www.debugbear.com/signup" class="ctaButton_Uos9 hidden-when-logged-in"><span>Start Free Trial</span></a><a href="https://www.debugbear.com/app" class="ctaButton_Uos9 visible-when-logged-in"><span>Go To App</span></a></div></div></div></div>]]></content>
        <author>
            <name>Matt Zeunert</name>
        </author>
    </entry>
    <entry>
        <title type="html"><![CDATA[Use Cookie-Free Domains To Avoid Unnecessary Network Traffic]]></title>
        <id>https://www.debugbear.com/software/use-cookie-free-domains</id>
        <link href="https://www.debugbear.com/software/use-cookie-free-domains"/>
        <updated>2025-12-11T00:00:00.000Z</updated>
        <summary type="html"><![CDATA[Learn why cookie-free domains can improve page speed by reducing unnecessary data transfer. Discover when this optimization matters and what modern alternatives are more effective for web performance.]]></summary>
        <content type="html"><![CDATA[<p>Using cookie-free domains for static content can, in some cases, reduce network traffic when loading a web page. However, it is also a somewhat outdated optimization.</p>
<p>Read this article to learn what the benefits of cookie-free domains are, and why there are often better ways to speed up your website.</p>
<h2 class="anchor anchorWithStickyNavbar_FNw8" id="why-can-cookie-free-domains-be-good-for-page-speed">Why can cookie-free domains be good for page speed?<a href="https://www.debugbear.com/software/use-cookie-free-domains#why-can-cookie-free-domains-be-good-for-page-speed" class="hash-link" aria-label="Direct link to Why can cookie-free domains be good for page speed?" title="Direct link to Why can cookie-free domains be good for page speed?">​</a></h2>
<p>Cookies are data that are sent along with (almost) every request that the browser sends to a specific domain. For example, they are often used for authentication. After login the server sets a cookie in the browser, and it can then identify the authenticated session based on the cookie later on and send user-specific content.</p>
<p>However, the cookies are not useful when loading static files where the server responds with the same content for everyone. In this case, the browser still sends the cookies along with each request, increasing the amount of data that needs to be transferred.</p>
<p>When making many requests with large cookies, this data transfer can add up and start to impact your page speed.</p>
<p><img loading="lazy" src="https://www.debugbear.com/dimg/f75d8c6cad1f3b89d33ca7c3ff82ac8d.png" alt="Cookie header transfer" style="border-radius:4px" data-abc="true" class="img_CujE"></p>
<p>In contrast, when loading an image from a separate cookie-free domain, the request header data is smaller.</p>
<p><img loading="lazy" src="https://www.debugbear.com/dimg/64210c65ba9ff64b65c79a8bdb1e8ab3.png" alt="Cookie-free domain" style="border-radius:4px" data-abc="true" class="img_CujE"></p>
<p>You can see what cookies are sent with requests on your website by running a free <a href="https://www.debugbear.com/test/website-speed">website speed test</a>. The Requests tab shows you all the resources loaded on the page, and you can click on each one and open the Headers subtab to view any cookies that were sent.</p>
<h2 class="anchor anchorWithStickyNavbar_FNw8" id="use-cookie-free-domains-in-pingdom-and-yslow">Use cookie-free domains in Pingdom and YSlow<a href="https://www.debugbear.com/software/use-cookie-free-domains#use-cookie-free-domains-in-pingdom-and-yslow" class="hash-link" aria-label="Direct link to Use cookie-free domains in Pingdom and YSlow" title="Direct link to Use cookie-free domains in Pingdom and YSlow">​</a></h2>
<p>Tools that are based on the <a href="https://www.debugbear.com/software/yslow-alternatives">open-source YSlow library</a> detect when images are loaded from domains where cookies are set. For example, you can see this recommendation in the <a href="https://www.debugbear.com/software/pingdom-speed-test">Pingdom speed test</a> result.</p>
<p><img loading="lazy" src="https://www.debugbear.com/dimg/44e77223298b9bb0acaecf6d6c997978.png" alt="Use cookie-free domains recommendation in Pingdom" style="border-radius:4px" data-abc="true" class="img_CujE"></p>
<h2 class="anchor anchorWithStickyNavbar_FNw8" id="does-using-cookie-free-domains-still-matter">Does using cookie-free domains still matter?<a href="https://www.debugbear.com/software/use-cookie-free-domains#does-using-cookie-free-domains-still-matter" class="hash-link" aria-label="Direct link to Does using cookie-free domains still matter?" title="Direct link to Does using cookie-free domains still matter?">​</a></h2>
<p>Today, using cookie-free domains is rarely a performance optimization worth investing in.</p>
<p>There are two reasons for that:</p>
<ol>
<li>Cookies are relatively small, and have become smaller</li>
<li>New domains require a new server connection</li>
</ol>
<h3 class="anchor anchorWithStickyNavbar_FNw8" id="cookies-are-small">Cookies are small<a href="https://www.debugbear.com/software/use-cookie-free-domains#cookies-are-small" class="hash-link" aria-label="Direct link to Cookies are small" title="Direct link to Cookies are small">​</a></h3>
<p>Most cookies are just a couple of bytes long, so they don't increase the data transfer volume by much. In contrast, images often take hundreds of kilobytes to download, so <a href="https://www.debugbear.com/blog/improve-image-delivery">improving image delivery</a> has a lot more potential for impact.</p>
<p><a href="https://www.debugbear.com/blog/http1-vs-http2">HTTP/2</a> also introduced header compression. Cookies and other headers are no longer transferred as plain text but using the HPACK compression algorithm. This further reduces the impact of sending a few additional request headers.</p>
<h3 class="anchor anchorWithStickyNavbar_FNw8" id="new-domains-require-a-new-server-connection">New domains require a new server connection<a href="https://www.debugbear.com/software/use-cookie-free-domains#new-domains-require-a-new-server-connection" class="hash-link" aria-label="Direct link to New domains require a new server connection" title="Direct link to New domains require a new server connection">​</a></h3>
<p>Loading a resource from a new domain also requires time to establish a new <a href="https://www.debugbear.com/blog/http-server-connections">HTTP server connection</a>. That means the static content is delayed by several network round trips. It also requires additional data to be transferred, for example for the SSL certificate exchange.</p>
<p>In a <a href="https://www.debugbear.com/docs/waterfall">request waterfall</a> you can see the server connection as the three teal, orange, and purple boxes ahead of the HTTP request.</p>
<p><img loading="lazy" src="https://www.debugbear.com/dimg/d1d6382e99fbecf8bf27009cc0071b40.png" alt="New server connection for a new domain" style="border-radius:4px" data-abc="true" class="img_CujE"></p>
<h2 class="anchor anchorWithStickyNavbar_FNw8" id="measure-performance-and-focus-on-the-most-impactful-optimizations">Measure performance and focus on the most impactful optimizations<a href="https://www.debugbear.com/software/use-cookie-free-domains#measure-performance-and-focus-on-the-most-impactful-optimizations" class="hash-link" aria-label="Direct link to Measure performance and focus on the most impactful optimizations" title="Direct link to Measure performance and focus on the most impactful optimizations">​</a></h2>
<p>If you want to speed up your website, use a modern tool like our <a href="https://www.debugbear.com/test/website-speed">website speed test</a> or <a href="https://pagespeed.web.dev/" target="_blank" rel="noopener noreferrer">Google PageSpeed Insights</a>. That way you get detailed recommendations based on the most impactful changes you can make on your website.</p>
<p>We've also published a detailed guide on <a href="https://www.debugbear.com/blog/improve-website-performance">how you can improve your website speed</a>.</p>
<p><img loading="lazy" src="https://www.debugbear.com/dimg/452d5f91bdc3170fd5ccdad9a79140b7.png" alt="PageSpeed Insights result" style="border-radius:4px" data-abc="true" class="img_CujE"></p>
<h2 class="anchor anchorWithStickyNavbar_FNw8" id="deliver-a-great-user-experience-with-a-fast-website">Deliver a great user experience with a fast website<a href="https://www.debugbear.com/software/use-cookie-free-domains#deliver-a-great-user-experience-with-a-fast-website" class="hash-link" aria-label="Direct link to Deliver a great user experience with a fast website" title="Direct link to Deliver a great user experience with a fast website">​</a></h2>
<p>If you want to optimize your website and keep it fast you can use a <a href="https://www.debugbear.com/">web performance monitoring tool like DebugBear</a>. It runs regular tests and alerts you when anything goes wrong.</p>
<p>You can also set up <a href="https://www.debugbear.com/real-user-monitoring">real user monitoring</a> to measure actual visitor experience on your website.</p>
<p><img loading="lazy" src="https://www.debugbear.com/dimg/452d5f91bdc3170fd5ccdad9a79140b7.png" alt="DebugBear monitoring data" style="border-radius:4px" data-abc="true" class="img_CujE"></p>
<!-- -->
<div class="cta_Vy7l"><div class="ctaContainer_dzq8"><div class="ctaImage_MZ5b"><img src="https://www.debugbear.com/dimg/57001785e35454b95f43aa4f3bf6f857.png" alt="Illustration of website monitoring" class="themedComponent_mlkZ themedComponent--light_NVdE"><img src="https://www.debugbear.com/dimg/b2c0ae7a8dfbc4b18ba827a334c5c1af.png" alt="Illustration of website monitoring" class="themedComponent_mlkZ themedComponent--dark_xIcU"></div><div class="ctaContent_VgWi"><h2>Monitor Page Speed &amp; Core Web Vitals</h2><div class="ctaBenefits_OYw7"><h3>DebugBear monitoring includes:</h3><ul><li>In-depth Page Speed Reports</li><li>Automated Recommendations</li><li>Real User Analytics Data</li></ul></div><div><a href="https://www.debugbear.com/signup" class="ctaButton_Uos9 hidden-when-logged-in"><span>Start Free Trial</span></a><a href="https://www.debugbear.com/app" class="ctaButton_Uos9 visible-when-logged-in"><span>Go To App</span></a></div></div></div></div>]]></content>
        <author>
            <name>Matt Zeunert</name>
        </author>
    </entry>
    <entry>
        <title type="html"><![CDATA[6 Best Alternatives to Sentry In 2026]]></title>
        <id>https://www.debugbear.com/software/best-sentry-alternatives</id>
        <link href="https://www.debugbear.com/software/best-sentry-alternatives"/>
        <updated>2025-12-07T00:00:00.000Z</updated>
        <summary type="html"><![CDATA[Learn about the best alternatives to Sentry and what tools are the best fit for each use case.]]></summary>
        <content type="html"><![CDATA[<p><a href="https://sentry.io/" target="_blank" rel="noopener noreferrer">Sentry</a> is a popular application monitoring platform that helps developers identify and debug issues on their website.</p>
<p>In this guide, we'll explore six of the best Sentry alternatives and see what use case they are best for.</p>
<h2 class="anchor anchorWithStickyNavbar_FNw8" id="1-debugbear">1. DebugBear<a href="https://www.debugbear.com/software/best-sentry-alternatives#1-debugbear" class="hash-link" aria-label="Direct link to 1. DebugBear" title="Direct link to 1. DebugBear">​</a></h2>
<p><a href="https://www.debugbear.com/">DebugBear</a> is a website performance monitoring platform that focuses on synthetic testing and real user monitoring (RUM).</p>
<h3 class="anchor anchorWithStickyNavbar_FNw8" id="synthetic-monitoring">Synthetic monitoring<a href="https://www.debugbear.com/software/best-sentry-alternatives#synthetic-monitoring" class="hash-link" aria-label="Direct link to Synthetic monitoring" title="Direct link to Synthetic monitoring">​</a></h3>
<p>Scheduled synthetic tests let you collect monitoring data in a controlled test environment. Run tests
from over 30 global test locations and define test devices with a specific network and CPU speed.</p>
<p>Set up alerts to get notified of any performance regressions, and compare test results to each other to identify what change impacted your metrics.</p>
<p><img loading="lazy" src="https://www.debugbear.com/dimg/330e497683306aa95b6f986b1597684e.png" alt="Synthetic website monitoring dashboard" style="border-radius:4px" data-abc="true" class="img_CujE"></p>
<p>Each test includes detailed web performance reporting, as well as custom performance recommendations.</p>
<p>DebugBear also checks Google Lighthouse scores for Performance, SEO, Accessibility, and Best Practices.</p>
<p>The <a href="https://www.debugbear.com/docs/waterfall">request waterfall</a> shows how different resources loading on the network impact rendering progress.</p>
<p><img loading="lazy" src="https://www.debugbear.com/dimg/12023a249d405ea0b9fa21fc1238aaf2.png" alt="Request waterfall for performance analysis" style="border-radius:4px" data-abc="true" class="img_CujE"></p>
<p>You can also track JavaScript and console errors, and real user Core Web Vitals based on Google's Chrome User Experience Report (CrUX).</p>
<h3 class="anchor anchorWithStickyNavbar_FNw8" id="real-user-monitoring">Real user monitoring<a href="https://www.debugbear.com/software/best-sentry-alternatives#real-user-monitoring" class="hash-link" aria-label="Direct link to Real user monitoring" title="Direct link to Real user monitoring">​</a></h3>
<p>The DebugBear real user monitoring product focuses on visitor experience and Core Web Vitals metrics.</p>
<p>Identify specific slow pages on your website and diagnose what's causing slow load times, layout shifts, and slow interaction handling.</p>
<p><img loading="lazy" src="https://www.debugbear.com/dimg/a764217ac0070b2d6bf84e8148b63cdd.png" alt="Core Web Vitals RUM dashboard" style="border-radius:4px" data-abc="true" class="img_CujE"></p>
<p>The metric dashboards highlight specific requests and scripts that are causing delays.</p>
<p>For example, when debugging poor Interaction to Next Paint scores, you can see what scripts run during the interaction and what triggered them to run.</p>
<p><img loading="lazy" src="https://www.debugbear.com/dimg/c0e00b2436c7723206ddfebed0ffa5ff.png" alt="INP script breakdown" style="border-radius:4px" data-abc="true" class="img_CujE"></p>
<p>Other DebugBear RUM features:</p>
<ul>
<li>Track conversions to measure business impact</li>
<li>Optimize flow to detect fixes quickly</li>
<li>Report JavaScript errors</li>
</ul>
<p>Get started with a <a href="https://www.debugbear.com/signup">free trial</a>.</p>
<!-- -->
<div class="quickCta_c7mV"><div><div style="margin-bottom:8px;font-weight:600" class="d-flex align-items-center"><div style="height:16px"><svg xmlns="http://www.w3.org/2000/svg" fill="none" viewBox="0 0 10 10" id="Data-Analytics--Streamline-Micro" height="16" width="16"><path stroke="currentColor" stroke-linecap="round" stroke-linejoin="round" d="M9.5 9.5 7.336 7.336" stroke-width="1"></path><path stroke="currentColor" stroke-linecap="round" stroke-linejoin="round" d="M4.5 8.5a4 4 0 1 0 0 -8 4 4 0 0 0 0 8Z" stroke-width="1"></path><path stroke="currentColor" stroke-linecap="round" stroke-linejoin="round" d="M6.447 3.11 5.334 5.055 3.666 3.944 2.553 5.89" stroke-width="1"></path></svg></div><div style="margin-left:8px">Core Web Vitals Monitoring</div></div><div style="opacity:0.7;font-size:13px">Synthetic Tests · Real User Monitoring · Google CrUX data</div></div><div class="quickCta__button_container_S232"><a href="https://www.debugbear.com/signup?via=quickcta" class="quickCta__button_ORb_ hidden-when-logged-in">➔ Start Free Trial</a><a href="https://www.debugbear.com/app" class="quickCta__button_ORb_ visible-when-logged-in">➔ Go To App</a></div></div>
<h2 class="anchor anchorWithStickyNavbar_FNw8" id="2-datadog">2. Datadog<a href="https://www.debugbear.com/software/best-sentry-alternatives#2-datadog" class="hash-link" aria-label="Direct link to 2. Datadog" title="Direct link to 2. Datadog">​</a></h2>
<p><a href="https://www.datadoghq.com/" target="_blank" rel="noopener noreferrer">Datadog</a> is a comprehensive observability platform that provides monitoring for infrastructure, applications, and logs.</p>
<p>Set up synthetic monitoring to monitor important user flows on your website, or collect real user analytics to identify issues faced by your visitors.</p>
<p><img loading="lazy" src="https://www.debugbear.com/dimg/541a643bdbd10e6415d2199f5a4b99c7.png" alt="DataDog web vitals dashboard" style="border-radius:4px" data-abc="true" class="img_CujE"></p>
<p>DataDog also supports in-depth infrastructure telemetry collection to monitor your servers and backend code.</p>
<p>One of DataDog's biggest strengths is the ability to create complex custom dashboards and alerting scenarios.</p>
<div class="theme-admonition theme-admonition-tip admonition_LMjb alert alert--success"><div class="admonitionHeading_GGQ4"><span class="admonitionIcon_ifdW"><svg viewBox="0 0 12 16"><path fill-rule="evenodd" d="M6.5 0C3.48 0 1 2.19 1 5c0 .92.55 2.25 1 3 1.34 2.25 1.78 2.78 2 4v1h5v-1c.22-1.22.66-1.75 2-4 .45-.75 1-2.08 1-3 0-2.81-2.48-5-5.5-5zm3.64 7.48c-.25.44-.47.8-.67 1.11-.86 1.41-1.25 2.06-1.45 3.23-.02.05-.02.11-.02.17H5c0-.06 0-.13-.02-.17-.2-1.17-.59-1.83-1.45-3.23-.2-.31-.42-.67-.67-1.11C2.44 6.78 2 5.65 2 5c0-2.2 2.02-4 4.5-4 1.22 0 2.36.42 3.22 1.19C10.55 2.94 11 3.94 11 5c0 .66-.44 1.78-.86 2.48zM4 14h5c-.23 1.14-1.3 2-2.5 2s-2.27-.86-2.5-2z"></path></svg></span>tip</div><div class="admonitionContent_pGk6"><p>DataDog is a great choice if you need an all-in-one monitoring platform.</p></div></div>
<h2 class="anchor anchorWithStickyNavbar_FNw8" id="3-rollbar">3. Rollbar<a href="https://www.debugbear.com/software/best-sentry-alternatives#3-rollbar" class="hash-link" aria-label="Direct link to 3. Rollbar" title="Direct link to 3. Rollbar">​</a></h2>
<p><a href="https://rollbar.com/" target="_blank" rel="noopener noreferrer">Rollbar</a> is a monitoring platform with a focus on error tracking. It supports a large number of frameworks and languages.</p>
<p>Get alerted to new errors and see how often specific errors occur.</p>
<p>You can get detailed insights on what led up to an error as well as reviewing the context where it happened, like browser version or window size. You can also see what specific visitors encountered an error on your website.</p>
<p><img loading="lazy" src="https://www.debugbear.com/dimg/94cb47c5d4d28f3f26dcb5c002be8778.png" alt="Rollbar error monitoring" style="border-radius:4px" data-abc="true" class="img_CujE"></p>
<h2 class="anchor anchorWithStickyNavbar_FNw8" id="4-posthog">4. PostHog<a href="https://www.debugbear.com/software/best-sentry-alternatives#4-posthog" class="hash-link" aria-label="Direct link to 4. PostHog" title="Direct link to 4. PostHog">​</a></h2>
<p><a href="https://posthog.com/" target="_blank" rel="noopener noreferrer">PostHog</a> is an open-source product analytics platform for product engineers. It includes session replay, feature flags, and error tracking capabilities.</p>
<p>Get detailed web analytics and build custom dashboards for reporting.</p>
<p><img loading="lazy" src="https://www.debugbear.com/dimg/86f52e7f93d9dbf90d76c0d328f547fb.png" alt="Posthog dashboard" style="border-radius:4px" data-abc="true" class="img_CujE"></p>
<p>PostHog lets you track marketing analytics, Core Web Vitals, as well as custom events. You can also connect the platform to other data sources like Google or LinkedIn Ads.</p>
<h2 class="anchor anchorWithStickyNavbar_FNw8" id="5-signoz">5. SigNoz<a href="https://www.debugbear.com/software/best-sentry-alternatives#5-signoz" class="hash-link" aria-label="Direct link to 5. SigNoz" title="Direct link to 5. SigNoz">​</a></h2>
<p><a href="https://signoz.io/" target="_blank" rel="noopener noreferrer">SigNoz</a> is an OpenTelemetry-based monitoring platform that lets you collect traces, logs, and custom metrics. You can self-host SigNoz or use their cloud offering.</p>
<p>See what's slowing down your website and collect custom metrics. SigNoz lets you build custom dashboards aggregating data for specific hosts or visitor segments.</p>
<p><img loading="lazy" src="https://www.debugbear.com/dimg/dbf5a6b3969e1f3ea4a9f722d5ef0ca7.png" alt="SigNoz dashboard" style="border-radius:4px" data-abc="true" class="img_CujE"></p>
<p>SigNoz provides a flexible platform for developers to build on. However, it does not support specific features out of the box and your team needs to set up custom data tracking or use OpenTelemetry-based integrations to collect data.</p>
<h2 class="anchor anchorWithStickyNavbar_FNw8" id="6-dynatrace">6. Dynatrace<a href="https://www.debugbear.com/software/best-sentry-alternatives#6-dynatrace" class="hash-link" aria-label="Direct link to 6. Dynatrace" title="Direct link to 6. Dynatrace">​</a></h2>
<p><a href="https://www.dynatrace.com/" target="_blank" rel="noopener noreferrer">Dynatrace</a> is an enterprise observability product similar to DataDog. Collect detailed infrastructure data to optimize your web application.</p>
<p>The product goes beyond basic monitoring and offers advanced features for security, compliance, and cloud monitoring.</p>
<p><a href="https://www.debugbear.com/software/dynatrace-synthetic-monitoring">Dynatrace synthetic monitoring</a> provides a large number of powerful configuration options, including many different global test locations.</p>
<p><img loading="lazy" src="https://www.debugbear.com/dimg/a8bd3fd1fb9e95437a8e82f856144ee9.png" alt="Dynatrace monitoring dashboard" style="border-radius:4px" data-abc="true" class="img_CujE"></p>
<h2 class="anchor anchorWithStickyNavbar_FNw8" id="choosing-the-right-sentry-alternative">Choosing the Right Sentry Alternative<a href="https://www.debugbear.com/software/best-sentry-alternatives#choosing-the-right-sentry-alternative" class="hash-link" aria-label="Direct link to Choosing the Right Sentry Alternative" title="Direct link to Choosing the Right Sentry Alternative">​</a></h2>
<p>When selecting an alternative to Sentry, consider these factors:</p>
<ol>
<li><strong>Your primary use case</strong>: Do you need error tracking, performance monitoring, or both?</li>
<li><strong>Team size and budget</strong>: Some tools are priced for enterprises, others for startups</li>
<li><strong>Infrastructure complexity</strong>: Simple apps may not need full-stack observability</li>
<li><strong>Integration needs</strong>: Check compatibility with your existing tools</li>
</ol>
<p>For example, DebugBear is great for in-depth end-user web performance monitoring. Rollbar is great if you primarily need an error monitoring tool. SigNoz provides a powerful platform to build on for custom reporting.</p>
<h2 class="anchor anchorWithStickyNavbar_FNw8" id="conclusion">Conclusion<a href="https://www.debugbear.com/software/best-sentry-alternatives#conclusion" class="hash-link" aria-label="Direct link to Conclusion" title="Direct link to Conclusion">​</a></h2>
<p>Sentry is a powerful monitoring tool built for developers. But it's not always the best fit for every team.</p>
<p>Ready to improve your web performance monitoring? <a href="https://www.debugbear.com/signup">Try DebugBear free for 14 days</a> and see how detailed synthetic reports and real user monitoring data can help you optimize user experience on your website.</p>
<!-- -->
<div class="cta_Vy7l"><div class="ctaContainer_dzq8"><div class="ctaImage_MZ5b"><img src="https://www.debugbear.com/dimg/57001785e35454b95f43aa4f3bf6f857.png" alt="Illustration of website monitoring" class="themedComponent_mlkZ themedComponent--light_NVdE"><img src="https://www.debugbear.com/dimg/b2c0ae7a8dfbc4b18ba827a334c5c1af.png" alt="Illustration of website monitoring" class="themedComponent_mlkZ themedComponent--dark_xIcU"></div><div class="ctaContent_VgWi"><h2>Monitor Page Speed &amp; Core Web Vitals</h2><div class="ctaBenefits_OYw7"><h3>DebugBear monitoring includes:</h3><ul><li>In-depth Page Speed Reports</li><li>Automated Recommendations</li><li>Real User Analytics Data</li></ul></div><div><a href="https://www.debugbear.com/signup" class="ctaButton_Uos9 hidden-when-logged-in"><span>Start Free Trial</span></a><a href="https://www.debugbear.com/app" class="ctaButton_Uos9 visible-when-logged-in"><span>Go To App</span></a></div></div></div></div>]]></content>
        <author>
            <name>Matt Zeunert</name>
        </author>
    </entry>
    <entry>
        <title type="html"><![CDATA[8 Best Website Monitoring Tools In 2026]]></title>
        <id>https://www.debugbear.com/software/best-website-monitoring-tools</id>
        <link href="https://www.debugbear.com/software/best-website-monitoring-tools"/>
        <updated>2025-10-27T00:00:00.000Z</updated>
        <summary type="html"><![CDATA[Compare the best website monitoring tools for performance, uptime, and Core Web Vitals. Find the right monitoring solution for your website.]]></summary>
        <content type="html"><![CDATA[<p>Continuous website monitoring helps you ensure that your website is providing a good user experience and helps you meet your business goals.</p>
<p>We've reviewed some of the best website monitoring tools and what their respective strengths are.</p>
<h2 class="anchor anchorWithStickyNavbar_FNw8" id="1-debugbear">1. DebugBear<a href="https://www.debugbear.com/software/best-website-monitoring-tools#1-debugbear" class="hash-link" aria-label="Direct link to 1. DebugBear" title="Direct link to 1. DebugBear">​</a></h2>
<p><a href="https://www.debugbear.com/">DebugBear</a> is a website monitoring tool that focuses on website performance and user experience. You can use it to measure and optimize page load time and Google Core Web Vitals metrics, and get alerted to any website regressions.</p>
<p><img loading="lazy" src="https://www.debugbear.com/dimg/60fda418d569a66c6c655b62dfc8715c.png" alt="Website monitoring data for Core Web Vitals" style="border-radius:4px" data-abc="true" class="img_CujE"></p>
<p>The product combines <a href="https://www.debugbear.com/synthetic-website-monitoring">scheduled synthetic tests</a> with <a href="https://www.debugbear.com/real-user-monitoring">real user analytics</a>. You can also use it to <a href="https://www.debugbear.com/docs/benchmark-website-performance">benchmark your website</a> against competitors using visitor data from Google's Chrome User Experience Report.</p>
<p>In addition to tracking high-level trends, DebugBear also provides in-depth technical reports that your development team can use to identify high-impact optimizations.</p>
<p>The <a href="https://www.debugbear.com/docs/experiments">experiments feature</a> lets you try out performance optimizations and measure their metric impact quickly, without deploying any production code.</p>
<p><img loading="lazy" src="https://www.debugbear.com/dimg/f85d4ebaf95d01758a52640f309da2f9.png" alt="DebugBear page speed recommendation" style="border-radius:4px" data-abc="true" class="img_CujE"></p>
<div class="theme-admonition theme-admonition-tip admonition_LMjb alert alert--success"><div class="admonitionHeading_GGQ4"><span class="admonitionIcon_ifdW"><svg viewBox="0 0 12 16"><path fill-rule="evenodd" d="M6.5 0C3.48 0 1 2.19 1 5c0 .92.55 2.25 1 3 1.34 2.25 1.78 2.78 2 4v1h5v-1c.22-1.22.66-1.75 2-4 .45-.75 1-2.08 1-3 0-2.81-2.48-5-5.5-5zm3.64 7.48c-.25.44-.47.8-.67 1.11-.86 1.41-1.25 2.06-1.45 3.23-.02.05-.02.11-.02.17H5c0-.06 0-.13-.02-.17-.2-1.17-.59-1.83-1.45-3.23-.2-.31-.42-.67-.67-1.11C2.44 6.78 2 5.65 2 5c0-2.2 2.02-4 4.5-4 1.22 0 2.36.42 3.22 1.19C10.55 2.94 11 3.94 11 5c0 .66-.44 1.78-.86 2.48zM4 14h5c-.23 1.14-1.3 2-2.5 2s-2.27-.86-2.5-2z"></path></svg></span>tip</div><div class="admonitionContent_pGk6"><p>DebugBear also offers a <a href="https://www.debugbear.com/test/website-speed">free website speed test</a> to run one-off checks on your website performance.</p></div></div>
<h2 class="anchor anchorWithStickyNavbar_FNw8" id="2-pingdom">2. Pingdom<a href="https://www.debugbear.com/software/best-website-monitoring-tools#2-pingdom" class="hash-link" aria-label="Direct link to 2. Pingdom" title="Direct link to 2. Pingdom">​</a></h2>
<p><a href="https://www.pingdom.com/" target="_blank" rel="noopener noreferrer">Pingdom</a> is a website monitoring tool that covers uptime monitoring, performance monitoring, infrastructure monitoring, and more. Test your website from different locations and get alerted to any performance regressions or downtime.</p>
<p><img loading="lazy" src="https://www.debugbear.com/dimg/7ea65ae7d421c16f89be3a5ea188920e.png" alt="Pingdom monitoring data" style="border-radius:4px" data-abc="true" class="img_CujE"></p>
<p>You can use Pingdom both to run synthetic tests and collect real user metrics from your website visitors.</p>
<h2 class="anchor anchorWithStickyNavbar_FNw8" id="3-ahrefs">3. Ahrefs<a href="https://www.debugbear.com/software/best-website-monitoring-tools#3-ahrefs" class="hash-link" aria-label="Direct link to 3. Ahrefs" title="Direct link to 3. Ahrefs">​</a></h2>
<p><a href="https://ahrefs.com/" target="_blank" rel="noopener noreferrer">Ahrefs</a> is an <a href="https://www.debugbear.com/software/best-seo-monitoring-tools">SEO monitoring tool</a> that provides detailed monitoring of keyword ranking and estimated website traffic. Get weekly reports of your website's marketing performance and identify new content opportunities.</p>
<p><img loading="lazy" src="https://www.debugbear.com/dimg/dbb838c1e39d97f828b5923be397adff.png" alt="Ahrefs position tracking" style="border-radius:4px" data-abc="true" class="img_CujE"></p>
<p>You can also research keyword data and see historical popularity trends. For example, you can keep track of estimated search volume, keyword difficulty, and how different websites have ranked over time.</p>
<p><img loading="lazy" src="https://www.debugbear.com/dimg/e9cd380e986ae3cb74a953f9f6b14f0b.png" alt="Ahrefs keyword analysis" style="border-radius:4px" data-abc="true" class="img_CujE"></p>
<h2 class="anchor anchorWithStickyNavbar_FNw8" id="4-statusgator">4. StatusGator<a href="https://www.debugbear.com/software/best-website-monitoring-tools#4-statusgator" class="hash-link" aria-label="Direct link to 4. StatusGator" title="Direct link to 4. StatusGator">​</a></h2>
<p><a href="https://statusgator.com/" target="_blank" rel="noopener noreferrer">StatusGator</a> can monitor your website uptime, but it's more focused on aggregating monitoring data for other services you rely on. When there's an outage, your IT team and users can quickly get notified of the issue.</p>
<p>The product provides a unified status page for services you rely on and lets you receive alerts in the channels where your team already works, like Slack or Microsoft Teams.</p>
<p><img loading="lazy" src="https://www.debugbear.com/dimg/8703de5afbdfddc91ba8be877f05cb54.png" alt="StatusGator status page aggregation" style="border-radius:4px" data-abc="true" class="img_CujE"></p>
<h2 class="anchor anchorWithStickyNavbar_FNw8" id="5-datadog">5. DataDog<a href="https://www.debugbear.com/software/best-website-monitoring-tools#5-datadog" class="hash-link" aria-label="Direct link to 5. DataDog" title="Direct link to 5. DataDog">​</a></h2>
<p><a href="https://www.datadoghq.com/" target="_blank" rel="noopener noreferrer">DataDog</a> is a comprehensive application performance monitoring (APM) suite. It's a great fit for technical teams that need to cover all monitoring needs from network monitoring to log management.</p>
<p>You can test front-end page speed, backend performance, uptime, and transaction speed all in one tool. Set up custom dashboards and alerts to stay on top of key website metrics.</p>
<p><img loading="lazy" src="https://www.debugbear.com/dimg/fffdeb76afdacb9773053b9e98e7fc3d.png" alt="Datadog website monitoring" style="border-radius:4px" data-abc="true" class="img_CujE"></p>
<h2 class="anchor anchorWithStickyNavbar_FNw8" id="6-seotesting">6. SEOTesting<a href="https://www.debugbear.com/software/best-website-monitoring-tools#6-seotesting" class="hash-link" aria-label="Direct link to 6. SEOTesting" title="Direct link to 6. SEOTesting">​</a></h2>
<p>SEOTesting tracks organic search traffic volume based on Google Search Console data. Get alerted to new keywords, pages that are declining in rankings, or new pages that were added to your website.</p>
<p>You can monitor clicks, impressions, and search result positions. By connecting Google Analytics data you also get insight into traffic that finds you via AI models like ChatGPT or Claude.</p>
<p><img loading="lazy" src="https://www.debugbear.com/dimg/0b6c0f59105cafa5ce5999de7017aa0a.png" alt="SEOTesting monitoring trends" style="border-radius:4px" data-abc="true" class="img_CujE"></p>
<p>As the name suggests, SEOTesting also helps you measure the impact of content changes on your website. Monitoring this helps you understand how your content changes impact your search rankings and traffic, and ensures you'll catch any changes that result in worse performance.</p>
<h2 class="anchor anchorWithStickyNavbar_FNw8" id="7-uptimerobot">7. UptimeRobot<a href="https://www.debugbear.com/software/best-website-monitoring-tools#7-uptimerobot" class="hash-link" aria-label="Direct link to 7. UptimeRobot" title="Direct link to 7. UptimeRobot">​</a></h2>
<p>As the name suggests, <a href="https://uptimerobot.com/" target="_blank" rel="noopener noreferrer">UptimeRobot</a> is a website monitoring service focused on uptime. Check that your website is working correctly and create public status pages for incident reporting.</p>
<p>UptimeRobot lets you monitor APIs, web pages, SSL status, and check that responses contain specific keywords.</p>
<p><img loading="lazy" src="https://www.debugbear.com/dimg/74b3b68caf47835989a7c76aeaac4660.png" alt="UptimeRobot monitoring setup" style="border-radius:4px" data-abc="true" class="img_CujE"></p>
<h2 class="anchor anchorWithStickyNavbar_FNw8" id="8-gtmetrix">8. GTmetrix<a href="https://www.debugbear.com/software/best-website-monitoring-tools#8-gtmetrix" class="hash-link" aria-label="Direct link to 8. GTmetrix" title="Direct link to 8. GTmetrix">​</a></h2>
<p><a href="https://gtmetrix.com/" target="_blank" rel="noopener noreferrer">GTmetrix</a> lets you run scheduled synthetic page speed tests for your website. You can pick different test locations and set up alerting thresholds to find out about performance problems.</p>
<p><img loading="lazy" src="https://www.debugbear.com/dimg/74b3b68caf47835989a7c76aeaac4660.png" alt="GTmetrix monitoring data" style="border-radius:4px" data-abc="true" class="img_CujE"></p>
<p>Check out this guide on <a href="https://www.debugbear.com/software/gtmetrix-speed-test">how to interpret the GTmetrix speed test</a>.</p>
<h2 class="anchor anchorWithStickyNavbar_FNw8" id="what-is-the-best-website-monitoring-tool">What is the best website monitoring tool?<a href="https://www.debugbear.com/software/best-website-monitoring-tools#what-is-the-best-website-monitoring-tool" class="hash-link" aria-label="Direct link to What is the best website monitoring tool?" title="Direct link to What is the best website monitoring tool?">​</a></h2>
<p>What website monitoring tool is right for you? It depends on the needs of your company. For example:</p>
<ul>
<li>DebugBear is great if you need comprehensive web performance insights</li>
<li>DataDog works for technical teams that need observability across their tech stack</li>
<li>Pingdom is a more budget-friendly solution that provides the basics around essential monitoring features</li>
</ul>
<h2 class="anchor anchorWithStickyNavbar_FNw8" id="website-monitoring-features-to-look-for">Website monitoring features to look for<a href="https://www.debugbear.com/software/best-website-monitoring-tools#website-monitoring-features-to-look-for" class="hash-link" aria-label="Direct link to Website monitoring features to look for" title="Direct link to Website monitoring features to look for">​</a></h2>
<p>When comparing different website monitoring solutions, consider these factors:</p>
<ul>
<li>What types of monitoring does the tool support?</li>
<li>Can you pick different monitoring locations?</li>
<li>What performance metrics does the tool let you track?</li>
<li>What test frequency can you schedule?</li>
<li>Does the tool offer integrations or an API?</li>
<li>How much historical data does the service store?</li>
</ul>
<h2 class="anchor anchorWithStickyNavbar_FNw8" id="monitoring-website-speed">Monitoring website speed<a href="https://www.debugbear.com/software/best-website-monitoring-tools#monitoring-website-speed" class="hash-link" aria-label="Direct link to Monitoring website speed" title="Direct link to Monitoring website speed">​</a></h2>
<p>If you care about website performance, try out <a href="https://www.debugbear.com/">DebugBear website monitoring</a> to get detailed insight into how fast your website is for your visitors.</p>
<p><img loading="lazy" src="https://www.debugbear.com/dimg/293da755cb0f6096378739fae3878492.png" alt="DebugBear synthetic website monitoring dashboard" style="border-radius:4px" data-abc="true" class="img_CujE"></p>
<!-- -->
<div class="cta_Vy7l"><div class="ctaContainer_dzq8"><div class="ctaImage_MZ5b"><img src="https://www.debugbear.com/dimg/57001785e35454b95f43aa4f3bf6f857.png" alt="Illustration of website monitoring" class="themedComponent_mlkZ themedComponent--light_NVdE"><img src="https://www.debugbear.com/dimg/b2c0ae7a8dfbc4b18ba827a334c5c1af.png" alt="Illustration of website monitoring" class="themedComponent_mlkZ themedComponent--dark_xIcU"></div><div class="ctaContent_VgWi"><h2>Monitor Page Speed &amp; Core Web Vitals</h2><div class="ctaBenefits_OYw7"><h3>DebugBear monitoring includes:</h3><ul><li>In-depth Page Speed Reports</li><li>Automated Recommendations</li><li>Real User Analytics Data</li></ul></div><div><a href="https://www.debugbear.com/signup" class="ctaButton_Uos9 hidden-when-logged-in"><span>Start Free Trial</span></a><a href="https://www.debugbear.com/app" class="ctaButton_Uos9 visible-when-logged-in"><span>Go To App</span></a></div></div></div></div>]]></content>
        <author>
            <name>Matt Zeunert</name>
        </author>
    </entry>
    <entry>
        <title type="html"><![CDATA[Optimizing Images For SEO: All You Need To Know]]></title>
        <id>https://www.debugbear.com/software/image-optimization-seo</id>
        <link href="https://www.debugbear.com/software/image-optimization-seo"/>
        <updated>2025-09-14T00:00:00.000Z</updated>
        <summary type="html"><![CDATA[Make your site's images work for you by boosting your performance in search results. Tips, best practices and more.]]></summary>
        <content type="html"><![CDATA[<p>Images are a powerful but often neglected component of search engine optimization (SEO). While many website publishers focus solely on text-based content, images present additional opportunities to improve your search visibility, drive organic traffic, and even earn backlinks.</p>
<p>This comprehensive guide explores the core SEO techniques for image optimization that can boost your search rankings even further.</p>
<h2 class="anchor anchorWithStickyNavbar_FNw8" id="where-do-images-appear-in-google-search">Where do images appear in Google search?<a href="https://www.debugbear.com/software/image-optimization-seo#where-do-images-appear-in-google-search" class="hash-link" aria-label="Direct link to Where do images appear in Google search?" title="Direct link to Where do images appear in Google search?">​</a></h2>
<p>Although Google search results are often text-heavy, Google uses images in all sorts of places in search results. By optimizing your images for SEO, your content will be considered for these placements, offering additional links to your website. Let's take a look!</p>
<h3 class="anchor anchorWithStickyNavbar_FNw8" id="image-pack-headers">Image pack headers<a href="https://www.debugbear.com/software/image-optimization-seo#image-pack-headers" class="hash-link" aria-label="Direct link to Image pack headers" title="Direct link to Image pack headers">​</a></h3>
<p>For searches where the user is likely to be seeking an image, the most prominent element is a grid of images right at the top of the page.</p>
<p><img loading="lazy" src="https://www.debugbear.com/dimg/2955d52d306b654f00aeb37e60419043.png" alt="Google showing an image header pack at the top of search results" style="border-radius:4px" data-abc="true" class="img_CujE"></p>
<h3 class="anchor anchorWithStickyNavbar_FNw8" id="knowledge-pack-headers">Knowledge pack headers<a href="https://www.debugbear.com/software/image-optimization-seo#knowledge-pack-headers" class="hash-link" aria-label="Direct link to Knowledge pack headers" title="Direct link to Knowledge pack headers">​</a></h3>
<p>For certain searches, particularly for proper nouns like names or places, a Knowledge Pack is displayed, which usually contains a few top images, as seen here on the left.</p>
<p><img loading="lazy" src="https://www.debugbear.com/dimg/1bac9172706a0d638e0539ad82026d10.png" alt="Google image results - in knowledge pack" style="border-radius:4px" data-abc="true" class="img_CujE"></p>
<h3 class="anchor anchorWithStickyNavbar_FNw8" id="image-packs-in-main-columns">Image packs in main columns<a href="https://www.debugbear.com/software/image-optimization-seo#image-packs-in-main-columns" class="hash-link" aria-label="Direct link to Image packs in main columns" title="Direct link to Image packs in main columns">​</a></h3>
<p>For searches where visual content is likely expected, Google might add an Image Pack in the main list of search results.</p>
<p><img loading="lazy" src="https://www.debugbear.com/dimg/56c4e13dbaf4bd00861598b383dd2152.png" alt="Image pack in central Google search results" style="border-radius:4px" data-abc="true" class="img_CujE"></p>
<h3 class="anchor anchorWithStickyNavbar_FNw8" id="image-pack-sidebars">Image pack sidebars<a href="https://www.debugbear.com/software/image-optimization-seo#image-pack-sidebars" class="hash-link" aria-label="Direct link to Image pack sidebars" title="Direct link to Image pack sidebars">​</a></h3>
<p>For searches where images are less central to the user's intent, Google may instead display them in the sidebar.</p>
<p><img loading="lazy" src="https://www.debugbear.com/dimg/f52d0e6abb1f0b2c51a0ff2f779ef2b1.png" alt="Google Image Pack in sidebar" style="border-radius:4px" data-abc="true" class="img_CujE"></p>
<h3 class="anchor anchorWithStickyNavbar_FNw8" id="alongside-featured-snippets-or-ai-overviews">Alongside featured snippets or AI overviews<a href="https://www.debugbear.com/software/image-optimization-seo#alongside-featured-snippets-or-ai-overviews" class="hash-link" aria-label="Direct link to Alongside featured snippets or AI overviews" title="Direct link to Alongside featured snippets or AI overviews">​</a></h3>
<p>When the search request triggers an AI overview or a featured snippet, this usually contains a couple of relevant images.</p>
<p><img loading="lazy" src="https://www.debugbear.com/dimg/3ed82ee8158ec5029e64c768de824313.png" alt="Images in Google featured snippets" style="border-radius:4px" data-abc="true" class="img_CujE"></p>
<h3 class="anchor anchorWithStickyNavbar_FNw8" id="serp-thumbnails">SERP thumbnails<a href="https://www.debugbear.com/software/image-optimization-seo#serp-thumbnails" class="hash-link" aria-label="Direct link to SERP thumbnails" title="Direct link to SERP thumbnails">​</a></h3>
<p>For other visually-oriented searches, Google will display thumbnails next to all the regular blue-link results.</p>
<p><img loading="lazy" src="https://www.debugbear.com/dimg/8709f6feb9b781423209f938146653ae.png" alt="Image thumbnails in Google search results" style="border-radius:4px" data-abc="true" class="img_CujE"></p>
<h3 class="anchor anchorWithStickyNavbar_FNw8" id="structured-data">Structured data<a href="https://www.debugbear.com/software/image-optimization-seo#structured-data" class="hash-link" aria-label="Direct link to Structured data" title="Direct link to Structured data">​</a></h3>
<p>Google offers a variety of other SERP features based around structured data from publishers, many of which include images. For instance, collections of news stories, recipes, shoppable products, and hotels are all accompanied by image thumbnails.</p>
<p><img loading="lazy" src="https://www.debugbear.com/dimg/0ad159b8b8b70bc116e569910acc627e.png" alt="Image thumbnails in Google news" style="border-radius:4px" data-abc="true" class="img_CujE"></p>
<h3 class="anchor anchorWithStickyNavbar_FNw8" id="google-image-search">Google Image Search<a href="https://www.debugbear.com/software/image-optimization-seo#google-image-search" class="hash-link" aria-label="Direct link to Google Image Search" title="Direct link to Google Image Search">​</a></h3>
<p>Of course, where the user selects Google Image Search, all the search results will be images!</p>
<p><img loading="lazy" src="https://www.debugbear.com/dimg/3a789eee296b9473ef57754876220773.jpg" alt="Google image search results" style="border-radius:4px" data-abc="true" class="img_CujE"></p>
<p>All told, well-optimized images give you a lot of additional opportunities for inclusion against keywords that Google determines to have a visual intent.</p>
<p>It's always worth manually checking your target keywords to see if the search results include photos, diagrams, graphics or other visuals. Your SEO research tool, like Ahrefs, will also let you filter for keywords with image-heavy components:</p>
<p><img loading="lazy" src="https://www.debugbear.com/dimg/068d9d57d77b55fb3a712d21acdb1cbd.png" alt="Filtering keywords for those that contain image-based SERP features in Ahrefs" style="border-radius:4px" data-abc="true" class="img_CujE"></p>
<h2 class="anchor anchorWithStickyNavbar_FNw8" id="how-to-optimize-your-images-for-seo">How to optimize your images for SEO<a href="https://www.debugbear.com/software/image-optimization-seo#how-to-optimize-your-images-for-seo" class="hash-link" aria-label="Direct link to How to optimize your images for SEO" title="Direct link to How to optimize your images for SEO">​</a></h2>
<h3 class="anchor anchorWithStickyNavbar_FNw8" id="1-put-the-keywords-in-the-filename">1. Put the keywords in the filename<a href="https://www.debugbear.com/software/image-optimization-seo#1-put-the-keywords-in-the-filename" class="hash-link" aria-label="Direct link to 1. Put the keywords in the filename" title="Direct link to 1. Put the keywords in the filename">​</a></h3>
<p>It's better to give your image a descriptive filename, like <code>water-cycle-diagram.png</code>, than something random like <code>BI89adf8A.jpg</code>. Check that your CMS isn't automatically changing it to a random string when it processes the image.</p>
<h3 class="anchor anchorWithStickyNavbar_FNw8" id="2-use-descriptive-keywords-in-the-alt-text">2. Use descriptive keywords in the alt text<a href="https://www.debugbear.com/software/image-optimization-seo#2-use-descriptive-keywords-in-the-alt-text" class="hash-link" aria-label="Direct link to 2. Use descriptive keywords in the alt text" title="Direct link to 2. Use descriptive keywords in the alt text">​</a></h3>
<p>Adding a descriptive piece of alt text to every image is crucial, not just for SEO, but also <a href="https://www.debugbear.com/blog/lighthouse-accessibility">accessibility</a>. Note that you do not need to include words like "A picture of..." or "An image of..." in the description! Avoid 'keyword stuffing' –&nbsp;a succinct but descriptive sentence will do.</p>
<pre tabindex="0" class="codeBlockStandalone_Nhx8 thin-scrollbar codeBlockContainer_aalF theme-code-block" style="--prism-color:#bfc7d5;--prism-background-color:#292d3e"><code class="codeBlockLines_RjmQ"><div class="language-html codeBlockContainer_aalF theme-code-block" style="--prism-color:#bfc7d5;--prism-background-color:#292d3e"><div class="codeBlockContent_MHx8"><pre tabindex="0" class="prism-code language-html codeBlock_zHgq thin-scrollbar" style="color:#bfc7d5;background-color:#292d3e"><code class="codeBlockLines_RjmQ"><span class="token-line" style="color:#bfc7d5"><span class="token tag punctuation" style="color:rgb(199, 146, 234)">&lt;</span><span class="token tag" style="color:rgb(255, 85, 114)">img</span><span class="token tag" style="color:rgb(255, 85, 114)"></span><br></span><span class="token-line" style="color:#bfc7d5"><span class="token tag" style="color:rgb(255, 85, 114)">  </span><span class="token tag attr-name" style="color:rgb(255, 203, 107)">src</span><span class="token tag attr-value punctuation attr-equals" style="color:rgb(199, 146, 234)">=</span><span class="token tag attr-value punctuation" style="color:rgb(199, 146, 234)">"</span><span class="token tag attr-value" style="color:rgb(255, 85, 114)">cheesy-pasta-dish.png</span><span class="token tag attr-value punctuation" style="color:rgb(199, 146, 234)">"</span><span class="token tag" style="color:rgb(255, 85, 114)"></span><br></span><span class="token-line" style="color:#bfc7d5"><span class="token tag" style="color:rgb(255, 85, 114)">  </span><span class="token tag attr-name" style="color:rgb(255, 203, 107)">alt</span><span class="token tag attr-value punctuation attr-equals" style="color:rgb(199, 146, 234)">=</span><span class="token tag attr-value punctuation" style="color:rgb(199, 146, 234)">"</span><span class="token tag attr-value" style="color:rgb(255, 85, 114)">A steaming plate of pasta and cheese, served on a red tablecloth.</span><span class="token tag attr-value punctuation" style="color:rgb(199, 146, 234)">"</span><span class="token tag" style="color:rgb(255, 85, 114)"></span><br></span><span class="token-line" style="color:#bfc7d5"><span class="token tag" style="color:rgb(255, 85, 114)"></span><span class="token tag punctuation" style="color:rgb(199, 146, 234)">/&gt;</span><br></span></code></pre><div class="buttonGroup_Sd8_"><button type="button" aria-label="Copy code to clipboard" title="Copy" class="clean-btn"><span class="copyButtonIcons_LnQD" aria-hidden="true"><svg viewBox="0 0 24 24" class="copyButtonIcon_t3l1"><path fill="currentColor" d="M19,21H8V7H19M19,5H8A2,2 0 0,0 6,7V21A2,2 0 0,0 8,23H19A2,2 0 0,0 21,21V7A2,2 0 0,0 19,5M16,1H4A2,2 0 0,0 2,3V17H4V3H16V1Z"></path></svg><svg viewBox="0 0 24 24" class="copyButtonSuccessIcon_IiZV"><path fill="currentColor" d="M21,7L9,19L3.5,13.5L4.91,12.09L9,16.17L19.59,5.59L21,7Z"></path></svg></span></button></div></div></div></code></pre>
<p>For SVG illustrations, rather than use an <code>alt=</code> attribute, you put a descriptive title tag immediately after the parent SVG tag:</p>
<pre tabindex="0" class="codeBlockStandalone_Nhx8 thin-scrollbar codeBlockContainer_aalF theme-code-block" style="--prism-color:#bfc7d5;--prism-background-color:#292d3e"><code class="codeBlockLines_RjmQ"><div class="language-html codeBlockContainer_aalF theme-code-block" style="--prism-color:#bfc7d5;--prism-background-color:#292d3e"><div class="codeBlockContent_MHx8"><pre tabindex="0" class="prism-code language-html codeBlock_zHgq thin-scrollbar" style="color:#bfc7d5;background-color:#292d3e"><code class="codeBlockLines_RjmQ"><span class="token-line" style="color:#bfc7d5"><span class="token tag punctuation" style="color:rgb(199, 146, 234)">&lt;</span><span class="token tag" style="color:rgb(255, 85, 114)">svg</span><span class="token tag" style="color:rgb(255, 85, 114)"> </span><span class="token tag attr-name" style="color:rgb(255, 203, 107)">width</span><span class="token tag attr-value punctuation attr-equals" style="color:rgb(199, 146, 234)">=</span><span class="token tag attr-value punctuation" style="color:rgb(199, 146, 234)">"</span><span class="token tag attr-value" style="color:rgb(255, 85, 114)">400</span><span class="token tag attr-value punctuation" style="color:rgb(199, 146, 234)">"</span><span class="token tag" style="color:rgb(255, 85, 114)"> </span><span class="token tag attr-name" style="color:rgb(255, 203, 107)">height</span><span class="token tag attr-value punctuation attr-equals" style="color:rgb(199, 146, 234)">=</span><span class="token tag attr-value punctuation" style="color:rgb(199, 146, 234)">"</span><span class="token tag attr-value" style="color:rgb(255, 85, 114)">300</span><span class="token tag attr-value punctuation" style="color:rgb(199, 146, 234)">"</span><span class="token tag" style="color:rgb(255, 85, 114)"> </span><span class="token tag attr-name" style="color:rgb(255, 203, 107)">xmlns</span><span class="token tag attr-value punctuation attr-equals" style="color:rgb(199, 146, 234)">=</span><span class="token tag attr-value punctuation" style="color:rgb(199, 146, 234)">"</span><span class="token tag attr-value" style="color:rgb(255, 85, 114)">http://www.w3.org/2000/svg</span><span class="token tag attr-value punctuation" style="color:rgb(199, 146, 234)">"</span><span class="token tag punctuation" style="color:rgb(199, 146, 234)">&gt;</span><span class="token plain"></span><br></span><span class="token-line" style="color:#bfc7d5"><span class="token plain">  </span><span class="token tag punctuation" style="color:rgb(199, 146, 234)">&lt;</span><span class="token tag" style="color:rgb(255, 85, 114)">title</span><span class="token tag punctuation" style="color:rgb(199, 146, 234)">&gt;</span><span class="token plain">A fluffy grey cloud floating on a sky blue background</span><span class="token tag punctuation" style="color:rgb(199, 146, 234)">&lt;/</span><span class="token tag" style="color:rgb(255, 85, 114)">title</span><span class="token tag punctuation" style="color:rgb(199, 146, 234)">&gt;</span><span class="token plain"></span><br></span><span class="token-line" style="color:#bfc7d5"><span class="token plain">&lt;rect width="400"...</span><br></span></code></pre><div class="buttonGroup_Sd8_"><button type="button" aria-label="Copy code to clipboard" title="Copy" class="clean-btn"><span class="copyButtonIcons_LnQD" aria-hidden="true"><svg viewBox="0 0 24 24" class="copyButtonIcon_t3l1"><path fill="currentColor" d="M19,21H8V7H19M19,5H8A2,2 0 0,0 6,7V21A2,2 0 0,0 8,23H19A2,2 0 0,0 21,21V7A2,2 0 0,0 19,5M16,1H4A2,2 0 0,0 2,3V17H4V3H16V1Z"></path></svg><svg viewBox="0 0 24 24" class="copyButtonSuccessIcon_IiZV"><path fill="currentColor" d="M21,7L9,19L3.5,13.5L4.91,12.09L9,16.17L19.59,5.59L21,7Z"></path></svg></span></button></div></div></div></code></pre>
<h3 class="anchor anchorWithStickyNavbar_FNw8" id="3-offer-a-high-resolution-version-of-the-image">3. Offer a high-resolution version of the image<a href="https://www.debugbear.com/software/image-optimization-seo#3-offer-a-high-resolution-version-of-the-image" class="hash-link" aria-label="Direct link to 3. Offer a high-resolution version of the image" title="Direct link to 3. Offer a high-resolution version of the image">​</a></h3>
<p>For performance purposes, try to offer images at a range of sizes, depending on the user's device.</p>
<p>Ideally, however, one version should be high resolution, suitable for a large desktop monitor with Retina density. Google can then use this image where it prefers, as image-focused searchers often prefer sharp, high-definition imagery.</p>
<div class="theme-admonition theme-admonition-tip admonition_LMjb alert alert--success"><div class="admonitionHeading_GGQ4"><span class="admonitionIcon_ifdW"><svg viewBox="0 0 12 16"><path fill-rule="evenodd" d="M6.5 0C3.48 0 1 2.19 1 5c0 .92.55 2.25 1 3 1.34 2.25 1.78 2.78 2 4v1h5v-1c.22-1.22.66-1.75 2-4 .45-.75 1-2.08 1-3 0-2.81-2.48-5-5.5-5zm3.64 7.48c-.25.44-.47.8-.67 1.11-.86 1.41-1.25 2.06-1.45 3.23-.02.05-.02.11-.02.17H5c0-.06 0-.13-.02-.17-.2-1.17-.59-1.83-1.45-3.23-.2-.31-.42-.67-.67-1.11C2.44 6.78 2 5.65 2 5c0-2.2 2.02-4 4.5-4 1.22 0 2.36.42 3.22 1.19C10.55 2.94 11 3.94 11 5c0 .66-.44 1.78-.86 2.48zM4 14h5c-.23 1.14-1.3 2-2.5 2s-2.27-.86-2.5-2z"></path></svg></span>tip</div><div class="admonitionContent_pGk6"><p>Our <a href="https://www.debugbear.com/blog/responsive-images" target="_blank" rel="noopener noreferrer">complete guide to responsive images</a> tells you everything you need to know – and more!</p></div></div>
<p>In the example below, we're offering the user (and Google) a large image at 2x resolution for users with large HD screens, while users with a smaller, non-retina screen (say on a basic mobile device) will be served a much smaller image, rather than something needlessly large.</p>
<pre tabindex="0" class="codeBlockStandalone_Nhx8 thin-scrollbar codeBlockContainer_aalF theme-code-block" style="--prism-color:#bfc7d5;--prism-background-color:#292d3e"><code class="codeBlockLines_RjmQ"><div class="language-html codeBlockContainer_aalF theme-code-block" style="--prism-color:#bfc7d5;--prism-background-color:#292d3e"><div class="codeBlockContent_MHx8"><pre tabindex="0" class="prism-code language-html codeBlock_zHgq thin-scrollbar" style="color:#bfc7d5;background-color:#292d3e"><code class="codeBlockLines_RjmQ"><span class="token-line" style="color:#bfc7d5"><span class="token tag punctuation" style="color:rgb(199, 146, 234)">&lt;</span><span class="token tag" style="color:rgb(255, 85, 114)">picture</span><span class="token tag punctuation" style="color:rgb(199, 146, 234)">&gt;</span><span class="token plain"></span><br></span><span class="token-line" style="color:#bfc7d5"><span class="token plain">  </span><span class="token tag punctuation" style="color:rgb(199, 146, 234)">&lt;</span><span class="token tag" style="color:rgb(255, 85, 114)">source</span><span class="token tag" style="color:rgb(255, 85, 114)"></span><br></span><span class="token-line" style="color:#bfc7d5"><span class="token tag" style="color:rgb(255, 85, 114)">    </span><span class="token tag attr-name" style="color:rgb(255, 203, 107)">media</span><span class="token tag attr-value punctuation attr-equals" style="color:rgb(199, 146, 234)">=</span><span class="token tag attr-value punctuation" style="color:rgb(199, 146, 234)">"</span><span class="token tag attr-value" style="color:rgb(255, 85, 114)">(min-width: 1200px)</span><span class="token tag attr-value punctuation" style="color:rgb(199, 146, 234)">"</span><span class="token tag" style="color:rgb(255, 85, 114)"></span><br></span><span class="token-line" style="color:#bfc7d5"><span class="token tag" style="color:rgb(255, 85, 114)">    </span><span class="token tag attr-name" style="color:rgb(255, 203, 107)">srcset</span><span class="token tag attr-value punctuation attr-equals" style="color:rgb(199, 146, 234)">=</span><span class="token tag attr-value punctuation" style="color:rgb(199, 146, 234)">"</span><span class="token tag attr-value" style="color:rgb(255, 85, 114)"></span><br></span><span class="token-line" style="color:#bfc7d5"><span class="token tag attr-value" style="color:rgb(255, 85, 114)">      navy-wool-sports-coat-large.webp     800w,</span><br></span><span class="token-line" style="color:#bfc7d5"><span class="token tag attr-value" style="color:rgb(255, 85, 114)">      navy-wool-sports-coat-large@2x.webp 1600w</span><br></span><span class="token-line" style="color:#bfc7d5"><span class="token tag attr-value" style="color:rgb(255, 85, 114)">    </span><span class="token tag attr-value punctuation" style="color:rgb(199, 146, 234)">"</span><span class="token tag" style="color:rgb(255, 85, 114)"></span><br></span><span class="token-line" style="color:#bfc7d5"><span class="token tag" style="color:rgb(255, 85, 114)">    </span><span class="token tag attr-name" style="color:rgb(255, 203, 107)">sizes</span><span class="token tag attr-value punctuation attr-equals" style="color:rgb(199, 146, 234)">=</span><span class="token tag attr-value punctuation" style="color:rgb(199, 146, 234)">"</span><span class="token tag attr-value" style="color:rgb(255, 85, 114)">(min-width: 1200px) 50vw</span><span class="token tag attr-value punctuation" style="color:rgb(199, 146, 234)">"</span><span class="token tag" style="color:rgb(255, 85, 114)"></span><br></span><span class="token-line" style="color:#bfc7d5"><span class="token tag" style="color:rgb(255, 85, 114)">  </span><span class="token tag punctuation" style="color:rgb(199, 146, 234)">/&gt;</span><span class="token plain"></span><br></span><span class="token-line" style="color:#bfc7d5"><span class="token plain">  </span><span class="token tag punctuation" style="color:rgb(199, 146, 234)">&lt;</span><span class="token tag" style="color:rgb(255, 85, 114)">source</span><span class="token tag" style="color:rgb(255, 85, 114)"></span><br></span><span class="token-line" style="color:#bfc7d5"><span class="token tag" style="color:rgb(255, 85, 114)">    </span><span class="token tag attr-name" style="color:rgb(255, 203, 107)">media</span><span class="token tag attr-value punctuation attr-equals" style="color:rgb(199, 146, 234)">=</span><span class="token tag attr-value punctuation" style="color:rgb(199, 146, 234)">"</span><span class="token tag attr-value" style="color:rgb(255, 85, 114)">(min-width: 768px)</span><span class="token tag attr-value punctuation" style="color:rgb(199, 146, 234)">"</span><span class="token tag" style="color:rgb(255, 85, 114)"></span><br></span><span class="token-line" style="color:#bfc7d5"><span class="token tag" style="color:rgb(255, 85, 114)">    </span><span class="token tag attr-name" style="color:rgb(255, 203, 107)">srcset</span><span class="token tag attr-value punctuation attr-equals" style="color:rgb(199, 146, 234)">=</span><span class="token tag attr-value punctuation" style="color:rgb(199, 146, 234)">"</span><span class="token tag attr-value" style="color:rgb(255, 85, 114)"></span><br></span><span class="token-line" style="color:#bfc7d5"><span class="token tag attr-value" style="color:rgb(255, 85, 114)">      navy-wool-sports-coat-medium.webp     600w,</span><br></span><span class="token-line" style="color:#bfc7d5"><span class="token tag attr-value" style="color:rgb(255, 85, 114)">      navy-wool-sports-coat-medium@2x.webp 1200w</span><br></span><span class="token-line" style="color:#bfc7d5"><span class="token tag attr-value" style="color:rgb(255, 85, 114)">    </span><span class="token tag attr-value punctuation" style="color:rgb(199, 146, 234)">"</span><span class="token tag" style="color:rgb(255, 85, 114)"></span><br></span><span class="token-line" style="color:#bfc7d5"><span class="token tag" style="color:rgb(255, 85, 114)">    </span><span class="token tag attr-name" style="color:rgb(255, 203, 107)">sizes</span><span class="token tag attr-value punctuation attr-equals" style="color:rgb(199, 146, 234)">=</span><span class="token tag attr-value punctuation" style="color:rgb(199, 146, 234)">"</span><span class="token tag attr-value" style="color:rgb(255, 85, 114)">(min-width: 768px) 60vw</span><span class="token tag attr-value punctuation" style="color:rgb(199, 146, 234)">"</span><span class="token tag" style="color:rgb(255, 85, 114)"></span><br></span><span class="token-line" style="color:#bfc7d5"><span class="token tag" style="color:rgb(255, 85, 114)">  </span><span class="token tag punctuation" style="color:rgb(199, 146, 234)">/&gt;</span><span class="token plain"></span><br></span><span class="token-line" style="color:#bfc7d5"><span class="token plain">  </span><span class="token tag punctuation" style="color:rgb(199, 146, 234)">&lt;</span><span class="token tag" style="color:rgb(255, 85, 114)">source</span><span class="token tag" style="color:rgb(255, 85, 114)"></span><br></span><span class="token-line" style="color:#bfc7d5"><span class="token tag" style="color:rgb(255, 85, 114)">    </span><span class="token tag attr-name" style="color:rgb(255, 203, 107)">media</span><span class="token tag attr-value punctuation attr-equals" style="color:rgb(199, 146, 234)">=</span><span class="token tag attr-value punctuation" style="color:rgb(199, 146, 234)">"</span><span class="token tag attr-value" style="color:rgb(255, 85, 114)">(max-width: 767px)</span><span class="token tag attr-value punctuation" style="color:rgb(199, 146, 234)">"</span><span class="token tag" style="color:rgb(255, 85, 114)"></span><br></span><span class="token-line" style="color:#bfc7d5"><span class="token tag" style="color:rgb(255, 85, 114)">    </span><span class="token tag attr-name" style="color:rgb(255, 203, 107)">srcset</span><span class="token tag attr-value punctuation attr-equals" style="color:rgb(199, 146, 234)">=</span><span class="token tag attr-value punctuation" style="color:rgb(199, 146, 234)">"</span><span class="token tag attr-value" style="color:rgb(255, 85, 114)"></span><br></span><span class="token-line" style="color:#bfc7d5"><span class="token tag attr-value" style="color:rgb(255, 85, 114)">      navy-wool-sports-coat-small.webp    400w,</span><br></span><span class="token-line" style="color:#bfc7d5"><span class="token tag attr-value" style="color:rgb(255, 85, 114)">      navy-wool-sports-coat-small@2x.webp 800w</span><br></span><span class="token-line" style="color:#bfc7d5"><span class="token tag attr-value" style="color:rgb(255, 85, 114)">    </span><span class="token tag attr-value punctuation" style="color:rgb(199, 146, 234)">"</span><span class="token tag" style="color:rgb(255, 85, 114)"></span><br></span><span class="token-line" style="color:#bfc7d5"><span class="token tag" style="color:rgb(255, 85, 114)">    </span><span class="token tag attr-name" style="color:rgb(255, 203, 107)">sizes</span><span class="token tag attr-value punctuation attr-equals" style="color:rgb(199, 146, 234)">=</span><span class="token tag attr-value punctuation" style="color:rgb(199, 146, 234)">"</span><span class="token tag attr-value" style="color:rgb(255, 85, 114)">100vw</span><span class="token tag attr-value punctuation" style="color:rgb(199, 146, 234)">"</span><span class="token tag" style="color:rgb(255, 85, 114)"></span><br></span><span class="token-line" style="color:#bfc7d5"><span class="token tag" style="color:rgb(255, 85, 114)">  </span><span class="token tag punctuation" style="color:rgb(199, 146, 234)">/&gt;</span><span class="token plain"></span><br></span><span class="token-line" style="color:#bfc7d5"><span class="token plain" style="display:inline-block"></span><br></span><span class="token-line" style="color:#bfc7d5"><span class="token plain">  </span><span class="token comment" style="color:rgb(105, 112, 152);font-style:italic">&lt;!-- Fallback for browsers that don't support WebP --&gt;</span><span class="token plain"></span><br></span><span class="token-line" style="color:#bfc7d5"><span class="token plain">  </span><span class="token tag punctuation" style="color:rgb(199, 146, 234)">&lt;</span><span class="token tag" style="color:rgb(255, 85, 114)">img</span><span class="token tag" style="color:rgb(255, 85, 114)"></span><br></span><span class="token-line" style="color:#bfc7d5"><span class="token tag" style="color:rgb(255, 85, 114)">    </span><span class="token tag attr-name" style="color:rgb(255, 203, 107)">src</span><span class="token tag attr-value punctuation attr-equals" style="color:rgb(199, 146, 234)">=</span><span class="token tag attr-value punctuation" style="color:rgb(199, 146, 234)">"</span><span class="token tag attr-value" style="color:rgb(255, 85, 114)">navy-wool-sports-coat-medium.jpg</span><span class="token tag attr-value punctuation" style="color:rgb(199, 146, 234)">"</span><span class="token tag" style="color:rgb(255, 85, 114)"></span><br></span><span class="token-line" style="color:#bfc7d5"><span class="token tag" style="color:rgb(255, 85, 114)">    </span><span class="token tag attr-name" style="color:rgb(255, 203, 107)">alt</span><span class="token tag attr-value punctuation attr-equals" style="color:rgb(199, 146, 234)">=</span><span class="token tag attr-value punctuation" style="color:rgb(199, 146, 234)">"</span><span class="token tag attr-value" style="color:rgb(255, 85, 114)">Navy blue wool sports coat displayed on mannequin, showing classic lapel design and tailored fit with two-button closure</span><span class="token tag attr-value punctuation" style="color:rgb(199, 146, 234)">"</span><span class="token tag" style="color:rgb(255, 85, 114)"></span><br></span><span class="token-line" style="color:#bfc7d5"><span class="token tag" style="color:rgb(255, 85, 114)">    </span><span class="token tag attr-name" style="color:rgb(255, 203, 107)">width</span><span class="token tag attr-value punctuation attr-equals" style="color:rgb(199, 146, 234)">=</span><span class="token tag attr-value punctuation" style="color:rgb(199, 146, 234)">"</span><span class="token tag attr-value" style="color:rgb(255, 85, 114)">600</span><span class="token tag attr-value punctuation" style="color:rgb(199, 146, 234)">"</span><span class="token tag" style="color:rgb(255, 85, 114)"></span><br></span><span class="token-line" style="color:#bfc7d5"><span class="token tag" style="color:rgb(255, 85, 114)">    </span><span class="token tag attr-name" style="color:rgb(255, 203, 107)">height</span><span class="token tag attr-value punctuation attr-equals" style="color:rgb(199, 146, 234)">=</span><span class="token tag attr-value punctuation" style="color:rgb(199, 146, 234)">"</span><span class="token tag attr-value" style="color:rgb(255, 85, 114)">800</span><span class="token tag attr-value punctuation" style="color:rgb(199, 146, 234)">"</span><span class="token tag" style="color:rgb(255, 85, 114)"></span><br></span><span class="token-line" style="color:#bfc7d5"><span class="token tag" style="color:rgb(255, 85, 114)">    </span><span class="token tag attr-name" style="color:rgb(255, 203, 107)">loading</span><span class="token tag attr-value punctuation attr-equals" style="color:rgb(199, 146, 234)">=</span><span class="token tag attr-value punctuation" style="color:rgb(199, 146, 234)">"</span><span class="token tag attr-value" style="color:rgb(255, 85, 114)">lazy</span><span class="token tag attr-value punctuation" style="color:rgb(199, 146, 234)">"</span><span class="token tag" style="color:rgb(255, 85, 114)"></span><br></span><span class="token-line" style="color:#bfc7d5"><span class="token tag" style="color:rgb(255, 85, 114)">    </span><span class="token tag attr-name" style="color:rgb(255, 203, 107)">decoding</span><span class="token tag attr-value punctuation attr-equals" style="color:rgb(199, 146, 234)">=</span><span class="token tag attr-value punctuation" style="color:rgb(199, 146, 234)">"</span><span class="token tag attr-value" style="color:rgb(255, 85, 114)">async</span><span class="token tag attr-value punctuation" style="color:rgb(199, 146, 234)">"</span><span class="token tag" style="color:rgb(255, 85, 114)"></span><br></span><span class="token-line" style="color:#bfc7d5"><span class="token tag" style="color:rgb(255, 85, 114)">    </span><span class="token tag special-attr attr-name" style="color:rgb(255, 203, 107)">style</span><span class="token tag special-attr attr-value punctuation attr-equals" style="color:rgb(199, 146, 234)">=</span><span class="token tag special-attr attr-value punctuation" style="color:rgb(199, 146, 234)">"</span><span class="token tag special-attr attr-value value css language-css property" style="color:rgb(255, 85, 114)">width</span><span class="token tag special-attr attr-value value css language-css punctuation" style="color:rgb(199, 146, 234)">:</span><span class="token tag special-attr attr-value value css language-css" style="color:rgb(255, 85, 114)"> </span><span class="token tag special-attr attr-value value css language-css number" style="color:rgb(247, 140, 108)">100</span><span class="token tag special-attr attr-value value css language-css unit" style="color:rgb(255, 85, 114)">%</span><span class="token tag special-attr attr-value value css language-css punctuation" style="color:rgb(199, 146, 234)">;</span><span class="token tag special-attr attr-value value css language-css" style="color:rgb(255, 85, 114)"> </span><span class="token tag special-attr attr-value value css language-css property" style="color:rgb(255, 85, 114)">height</span><span class="token tag special-attr attr-value value css language-css punctuation" style="color:rgb(199, 146, 234)">:</span><span class="token tag special-attr attr-value value css language-css" style="color:rgb(255, 85, 114)"> auto</span><span class="token tag special-attr attr-value value css language-css punctuation" style="color:rgb(199, 146, 234)">;</span><span class="token tag special-attr attr-value value css language-css" style="color:rgb(255, 85, 114)"> </span><span class="token tag special-attr attr-value value css language-css property" style="color:rgb(255, 85, 114)">max-width</span><span class="token tag special-attr attr-value value css language-css punctuation" style="color:rgb(199, 146, 234)">:</span><span class="token tag special-attr attr-value value css language-css" style="color:rgb(255, 85, 114)"> </span><span class="token tag special-attr attr-value value css language-css number" style="color:rgb(247, 140, 108)">600</span><span class="token tag special-attr attr-value value css language-css unit" style="color:rgb(255, 85, 114)">px</span><span class="token tag special-attr attr-value value css language-css punctuation" style="color:rgb(199, 146, 234)">;</span><span class="token tag special-attr attr-value value css language-css" style="color:rgb(255, 85, 114)"> </span><span class="token tag special-attr attr-value value css language-css property" style="color:rgb(255, 85, 114)">object-fit</span><span class="token tag special-attr attr-value value css language-css punctuation" style="color:rgb(199, 146, 234)">:</span><span class="token tag special-attr attr-value value css language-css" style="color:rgb(255, 85, 114)"> cover</span><span class="token tag special-attr attr-value value css language-css punctuation" style="color:rgb(199, 146, 234)">;</span><span class="token tag special-attr attr-value punctuation" style="color:rgb(199, 146, 234)">"</span><span class="token tag" style="color:rgb(255, 85, 114)"></span><br></span><span class="token-line" style="color:#bfc7d5"><span class="token tag" style="color:rgb(255, 85, 114)">  </span><span class="token tag punctuation" style="color:rgb(199, 146, 234)">/&gt;</span><span class="token plain"></span><br></span><span class="token-line" style="color:#bfc7d5"><span class="token plain"></span><span class="token tag punctuation" style="color:rgb(199, 146, 234)">&lt;/</span><span class="token tag" style="color:rgb(255, 85, 114)">picture</span><span class="token tag punctuation" style="color:rgb(199, 146, 234)">&gt;</span><br></span></code></pre><div class="buttonGroup_Sd8_"><button type="button" aria-label="Copy code to clipboard" title="Copy" class="clean-btn"><span class="copyButtonIcons_LnQD" aria-hidden="true"><svg viewBox="0 0 24 24" class="copyButtonIcon_t3l1"><path fill="currentColor" d="M19,21H8V7H19M19,5H8A2,2 0 0,0 6,7V21A2,2 0 0,0 8,23H19A2,2 0 0,0 21,21V7A2,2 0 0,0 19,5M16,1H4A2,2 0 0,0 2,3V17H4V3H16V1Z"></path></svg><svg viewBox="0 0 24 24" class="copyButtonSuccessIcon_IiZV"><path fill="currentColor" d="M21,7L9,19L3.5,13.5L4.91,12.09L9,16.17L19.59,5.59L21,7Z"></path></svg></span></button></div></div></div></code></pre>
<h3 class="anchor anchorWithStickyNavbar_FNw8" id="4-think-about-the-surrounding-page-content">4. Think about the surrounding page content<a href="https://www.debugbear.com/software/image-optimization-seo#4-think-about-the-surrounding-page-content" class="hash-link" aria-label="Direct link to 4. Think about the surrounding page content" title="Direct link to 4. Think about the surrounding page content">​</a></h3>
<p>Google also learns about your page, and the images on it, from the surrounding text.</p>
<p>Therefore, it's worth adding rich headings, captions, and descriptions. If you know your users are specifically searching for images in their request, then it's wise to optimize your page for this. For example, here we mention all our relevant keywords in the page title, heading and caption.</p>
<pre tabindex="0" class="codeBlockStandalone_Nhx8 thin-scrollbar codeBlockContainer_aalF theme-code-block" style="--prism-color:#bfc7d5;--prism-background-color:#292d3e"><code class="codeBlockLines_RjmQ"><div class="language-html codeBlockContainer_aalF theme-code-block" style="--prism-color:#bfc7d5;--prism-background-color:#292d3e"><div class="codeBlockContent_MHx8"><pre tabindex="0" class="prism-code language-html codeBlock_zHgq thin-scrollbar" style="color:#bfc7d5;background-color:#292d3e"><code class="codeBlockLines_RjmQ"><span class="token-line" style="color:#bfc7d5"><span class="token tag punctuation" style="color:rgb(199, 146, 234)">&lt;</span><span class="token tag" style="color:rgb(255, 85, 114)">title</span><span class="token tag punctuation" style="color:rgb(199, 146, 234)">&gt;</span><span class="token plain"></span><br></span><span class="token-line" style="color:#bfc7d5"><span class="token plain">  Controlling motors with circuits [with circuit diagrams to download]</span><br></span><span class="token-line" style="color:#bfc7d5"><span class="token plain"></span><span class="token tag punctuation" style="color:rgb(199, 146, 234)">&lt;/</span><span class="token tag" style="color:rgb(255, 85, 114)">title</span><span class="token tag punctuation" style="color:rgb(199, 146, 234)">&gt;</span><span class="token plain"></span><br></span><span class="token-line" style="color:#bfc7d5"><span class="token plain" style="display:inline-block"></span><br></span><span class="token-line" style="color:#bfc7d5"><span class="token plain">...</span><br></span><span class="token-line" style="color:#bfc7d5"><span class="token plain" style="display:inline-block"></span><br></span><span class="token-line" style="color:#bfc7d5"><span class="token plain"></span><span class="token tag punctuation" style="color:rgb(199, 146, 234)">&lt;</span><span class="token tag" style="color:rgb(255, 85, 114)">h2</span><span class="token tag punctuation" style="color:rgb(199, 146, 234)">&gt;</span><span class="token plain">Motor controller circuits explained</span><span class="token tag punctuation" style="color:rgb(199, 146, 234)">&lt;/</span><span class="token tag" style="color:rgb(255, 85, 114)">h2</span><span class="token tag punctuation" style="color:rgb(199, 146, 234)">&gt;</span><span class="token plain"></span><br></span><span class="token-line" style="color:#bfc7d5"><span class="token plain">What components can we add to our circuit to control the motor's behaviour? This</span><br></span><span class="token-line" style="color:#bfc7d5"><span class="token plain">diagram shows a basic example:</span><br></span><span class="token-line" style="color:#bfc7d5"><span class="token plain"></span><span class="token tag punctuation" style="color:rgb(199, 146, 234)">&lt;</span><span class="token tag" style="color:rgb(255, 85, 114)">figure</span><span class="token tag punctuation" style="color:rgb(199, 146, 234)">&gt;</span><span class="token plain"></span><br></span><span class="token-line" style="color:#bfc7d5"><span class="token plain">  </span><span class="token tag punctuation" style="color:rgb(199, 146, 234)">&lt;</span><span class="token tag" style="color:rgb(255, 85, 114)">img</span><span class="token tag" style="color:rgb(255, 85, 114)"></span><br></span><span class="token-line" style="color:#bfc7d5"><span class="token tag" style="color:rgb(255, 85, 114)">    </span><span class="token tag attr-name" style="color:rgb(255, 203, 107)">src</span><span class="token tag attr-value punctuation attr-equals" style="color:rgb(199, 146, 234)">=</span><span class="token tag attr-value punctuation" style="color:rgb(199, 146, 234)">"</span><span class="token tag attr-value" style="color:rgb(255, 85, 114)">simple-DC-motor-controller.jpg</span><span class="token tag attr-value punctuation" style="color:rgb(199, 146, 234)">"</span><span class="token tag" style="color:rgb(255, 85, 114)"></span><br></span><span class="token-line" style="color:#bfc7d5"><span class="token tag" style="color:rgb(255, 85, 114)">    </span><span class="token tag attr-name" style="color:rgb(255, 203, 107)">alt</span><span class="token tag attr-value punctuation attr-equals" style="color:rgb(199, 146, 234)">=</span><span class="token tag attr-value punctuation" style="color:rgb(199, 146, 234)">"</span><span class="token tag attr-value" style="color:rgb(255, 85, 114)">Circuit diagram of a simple DC motor controller.</span><span class="token tag attr-value punctuation" style="color:rgb(199, 146, 234)">"</span><span class="token tag" style="color:rgb(255, 85, 114)"></span><br></span><span class="token-line" style="color:#bfc7d5"><span class="token tag" style="color:rgb(255, 85, 114)">    </span><span class="token tag special-attr attr-name" style="color:rgb(255, 203, 107)">style</span><span class="token tag special-attr attr-value punctuation attr-equals" style="color:rgb(199, 146, 234)">=</span><span class="token tag special-attr attr-value punctuation" style="color:rgb(199, 146, 234)">"</span><span class="token tag special-attr attr-value value css language-css property" style="color:rgb(255, 85, 114)">width</span><span class="token tag special-attr attr-value value css language-css punctuation" style="color:rgb(199, 146, 234)">:</span><span class="token tag special-attr attr-value value css language-css number" style="color:rgb(247, 140, 108)">100</span><span class="token tag special-attr attr-value value css language-css unit" style="color:rgb(255, 85, 114)">%</span><span class="token tag special-attr attr-value punctuation" style="color:rgb(199, 146, 234)">"</span><span class="token tag" style="color:rgb(255, 85, 114)"></span><br></span><span class="token-line" style="color:#bfc7d5"><span class="token tag" style="color:rgb(255, 85, 114)">  </span><span class="token tag punctuation" style="color:rgb(199, 146, 234)">/&gt;</span><span class="token plain"></span><br></span><span class="token-line" style="color:#bfc7d5"><span class="token plain">  </span><span class="token tag punctuation" style="color:rgb(199, 146, 234)">&lt;</span><span class="token tag" style="color:rgb(255, 85, 114)">figcaption</span><span class="token tag punctuation" style="color:rgb(199, 146, 234)">&gt;</span><span class="token plain">Figure 1. A diagram of a simple DC motor controller.</span><span class="token tag punctuation" style="color:rgb(199, 146, 234)">&lt;/</span><span class="token tag" style="color:rgb(255, 85, 114)">figcaption</span><span class="token tag punctuation" style="color:rgb(199, 146, 234)">&gt;</span><span class="token plain"></span><br></span><span class="token-line" style="color:#bfc7d5"><span class="token plain"></span><span class="token tag punctuation" style="color:rgb(199, 146, 234)">&lt;/</span><span class="token tag" style="color:rgb(255, 85, 114)">figure</span><span class="token tag punctuation" style="color:rgb(199, 146, 234)">&gt;</span><br></span></code></pre><div class="buttonGroup_Sd8_"><button type="button" aria-label="Copy code to clipboard" title="Copy" class="clean-btn"><span class="copyButtonIcons_LnQD" aria-hidden="true"><svg viewBox="0 0 24 24" class="copyButtonIcon_t3l1"><path fill="currentColor" d="M19,21H8V7H19M19,5H8A2,2 0 0,0 6,7V21A2,2 0 0,0 8,23H19A2,2 0 0,0 21,21V7A2,2 0 0,0 19,5M16,1H4A2,2 0 0,0 2,3V17H4V3H16V1Z"></path></svg><svg viewBox="0 0 24 24" class="copyButtonSuccessIcon_IiZV"><path fill="currentColor" d="M21,7L9,19L3.5,13.5L4.91,12.09L9,16.17L19.59,5.59L21,7Z"></path></svg></span></button></div></div></div></code></pre>
<h3 class="anchor anchorWithStickyNavbar_FNw8" id="5-use-actual-images-in-html--not-css-techniques">5. Use actual images in HTML – not CSS techniques<a href="https://www.debugbear.com/software/image-optimization-seo#5-use-actual-images-in-html--not-css-techniques" class="hash-link" aria-label="Direct link to 5. Use actual images in HTML – not CSS techniques" title="Direct link to 5. Use actual images in HTML – not CSS techniques">​</a></h3>
<p>Google doesn't save images referenced in CSS or offer them in search results –&nbsp;only those embedded
in the HTML page using typical tags such as <code>img</code>, <code>picture</code> and <code>figure</code>.</p>
<p>So, avoid elements like galleries that deliver images as CSS backgrounds. These
images will also tend to load slower due to the critical rendering path.</p>
<h3 class="anchor anchorWithStickyNavbar_FNw8" id="6-ensure-the-images-dont-slow-down-your-page">6. Ensure the images don't slow down your page<a href="https://www.debugbear.com/software/image-optimization-seo#6-ensure-the-images-dont-slow-down-your-page" class="hash-link" aria-label="Direct link to 6. Ensure the images don't slow down your page" title="Direct link to 6. Ensure the images don't slow down your page">​</a></h3>
<p>While users love high quality
images, delivering them can't come at the expense of page load speed. Optimizing
your images for performance will indirectly support your SEO goals, because
Google gives preferential treatment to fast-loading pages.</p>
<ul>
<li>Deliver <a href="https://www.debugbear.com/blog/image-formats" target="_blank" rel="noopener noreferrer">images in modern formats like WEBP and AVIF</a>
with smaller filesizes</li>
<li><a href="https://www.debugbear.com/blog/efficiently-encode-images" target="_blank" rel="noopener noreferrer">Compress your
images</a> to reduce file
size without compromising too much on quality, perhaps using an <a href="https://www.debugbear.com/software/online-image-optimization-tools" target="_blank" rel="noopener noreferrer">online image
compression
tool</a></li>
<li>Use
<a href="https://www.debugbear.com/blog/responsive-images" target="_blank" rel="noopener noreferrer">responsive image sizing</a> to
avoid serving pointlessly large files</li>
<li><a href="https://www.debugbear.com/docs/image-elements-do-not-have-explicit-width-and-height" target="_blank" rel="noopener noreferrer">Define the height and width of
images</a>
before they load, to avoid your <a href="https://www.debugbear.com/docs/metrics/cumulative-layout-shift" target="_blank" rel="noopener noreferrer">page layout
shifting</a> as
they render</li>
<li>Use <a href="https://www.debugbear.com/blog/image-lazy-loading" target="_blank" rel="noopener noreferrer">lazy loading for
images</a> outside the viewport</li>
<li>Prioritize the loading of any image that appears 'above the fold', especially
an <a href="https://www.debugbear.com/docs/metrics/largest-contentful-paint#optimize-lcp-images" target="_blank" rel="noopener noreferrer">LCP
image</a>,
perhaps by <a href="https://www.debugbear.com/blog/fetchpriority-attribute" target="_blank" rel="noopener noreferrer">manually setting a
fetchpriority</a></li>
<li>Avoid delivering large images <a href="https://www.debugbear.com/blog/base64-data-urls-html-css" target="_blank" rel="noopener noreferrer">with inline Base64 data
URIs</a>.</li>
</ul>
<p>Check out our full guide to <a href="https://www.debugbear.com/blog/image-optimization-web-performance">optimizing images for web performance</a>.</p>
<div class="theme-admonition theme-admonition-tip admonition_LMjb alert alert--success"><div class="admonitionHeading_GGQ4"><span class="admonitionIcon_ifdW"><svg viewBox="0 0 12 16"><path fill-rule="evenodd" d="M6.5 0C3.48 0 1 2.19 1 5c0 .92.55 2.25 1 3 1.34 2.25 1.78 2.78 2 4v1h5v-1c.22-1.22.66-1.75 2-4 .45-.75 1-2.08 1-3 0-2.81-2.48-5-5.5-5zm3.64 7.48c-.25.44-.47.8-.67 1.11-.86 1.41-1.25 2.06-1.45 3.23-.02.05-.02.11-.02.17H5c0-.06 0-.13-.02-.17-.2-1.17-.59-1.83-1.45-3.23-.2-.31-.42-.67-.67-1.11C2.44 6.78 2 5.65 2 5c0-2.2 2.02-4 4.5-4 1.22 0 2.36.42 3.22 1.19C10.55 2.94 11 3.94 11 5c0 .66-.44 1.78-.86 2.48zM4 14h5c-.23 1.14-1.3 2-2.5 2s-2.27-.86-2.5-2z"></path></svg></span>tip</div><div class="admonitionContent_pGk6"><p>Try our <a href="https://www.debugbear.com/test/website-speed">free website speed test</a> to see if images are hurting your page speed!</p><p><img loading="lazy" src="https://www.debugbear.com/dimg/7406425a3893242dd858a6e4a3eaac8e.png" alt="Page speed test result" style="border-radius:4px" data-abc="true" class="img_CujE"></p></div></div>
<h3 class="anchor anchorWithStickyNavbar_FNw8" id="7-feature-your-image-prominently-using-the-correct-code">7. Feature your image prominently using the correct code<a href="https://www.debugbear.com/software/image-optimization-seo#7-feature-your-image-prominently-using-the-correct-code" class="hash-link" aria-label="Direct link to 7. Feature your image prominently using the correct code" title="Direct link to 7. Feature your image prominently using the correct code">​</a></h3>
<p>If your page has a hero image, make sure it appears prominently on the web. One standard approach is to define the key graphic using the Open Graph tag, which ensures it appears as the thumbnail when shared on social media, in chat apps, and so on.</p>
<pre tabindex="0" class="codeBlockStandalone_Nhx8 thin-scrollbar codeBlockContainer_aalF theme-code-block" style="--prism-color:#bfc7d5;--prism-background-color:#292d3e"><code class="codeBlockLines_RjmQ"><div class="language-html codeBlockContainer_aalF theme-code-block" style="--prism-color:#bfc7d5;--prism-background-color:#292d3e"><div class="codeBlockContent_MHx8"><pre tabindex="0" class="prism-code language-html codeBlock_zHgq thin-scrollbar" style="color:#bfc7d5;background-color:#292d3e"><code class="codeBlockLines_RjmQ"><span class="token-line" style="color:#bfc7d5"><span class="token tag punctuation" style="color:rgb(199, 146, 234)">&lt;</span><span class="token tag" style="color:rgb(255, 85, 114)">meta</span><span class="token tag" style="color:rgb(255, 85, 114)"> </span><span class="token tag attr-name" style="color:rgb(255, 203, 107)">property</span><span class="token tag attr-value punctuation attr-equals" style="color:rgb(199, 146, 234)">=</span><span class="token tag attr-value punctuation" style="color:rgb(199, 146, 234)">"</span><span class="token tag attr-value" style="color:rgb(255, 85, 114)">og:image</span><span class="token tag attr-value punctuation" style="color:rgb(199, 146, 234)">"</span><span class="token tag" style="color:rgb(255, 85, 114)"> </span><span class="token tag attr-name" style="color:rgb(255, 203, 107)">content</span><span class="token tag attr-value punctuation attr-equals" style="color:rgb(199, 146, 234)">=</span><span class="token tag attr-value punctuation" style="color:rgb(199, 146, 234)">"</span><span class="token tag attr-value" style="color:rgb(255, 85, 114)">https://example.com/ice-cream</span><span class="token tag attr-value punctuation" style="color:rgb(199, 146, 234)">"</span><span class="token tag" style="color:rgb(255, 85, 114)"> </span><span class="token tag punctuation" style="color:rgb(199, 146, 234)">/&gt;</span><br></span></code></pre><div class="buttonGroup_Sd8_"><button type="button" aria-label="Copy code to clipboard" title="Copy" class="clean-btn"><span class="copyButtonIcons_LnQD" aria-hidden="true"><svg viewBox="0 0 24 24" class="copyButtonIcon_t3l1"><path fill="currentColor" d="M19,21H8V7H19M19,5H8A2,2 0 0,0 6,7V21A2,2 0 0,0 8,23H19A2,2 0 0,0 21,21V7A2,2 0 0,0 19,5M16,1H4A2,2 0 0,0 2,3V17H4V3H16V1Z"></path></svg><svg viewBox="0 0 24 24" class="copyButtonSuccessIcon_IiZV"><path fill="currentColor" d="M21,7L9,19L3.5,13.5L4.91,12.09L9,16.17L19.59,5.59L21,7Z"></path></svg></span></button></div></div></div></code></pre>
<p>The result is something like this:</p>
<p><img loading="lazy" src="https://www.debugbear.com/dimg/766123b4090a068d41c58d2e81bd829d.png" alt="Image SEO - optimize open graph
og" style="border-radius:4px" data-abc="true" class="img_CujE"></p>
<p>To appear in Google's structured data enrichments - such as lists of recipes,
products or news articles – you'll need to <a href="https://developers.google.com/search/docs/appearance/structured-data/search-gallery" target="_blank" rel="noopener noreferrer">follow the relevant
schema</a>
and ensure your imagery complies with the guidelines.</p>
<p>Google suggests offering three possible images in square, landscape and widescreen formats. Here's how
that might look for a news article:</p>
<pre tabindex="0" class="codeBlockStandalone_Nhx8 thin-scrollbar codeBlockContainer_aalF theme-code-block" style="--prism-color:#bfc7d5;--prism-background-color:#292d3e"><code class="codeBlockLines_RjmQ"><div class="language-html codeBlockContainer_aalF theme-code-block" style="--prism-color:#bfc7d5;--prism-background-color:#292d3e"><div class="codeBlockContent_MHx8"><pre tabindex="0" class="prism-code language-html codeBlock_zHgq thin-scrollbar" style="color:#bfc7d5;background-color:#292d3e"><code class="codeBlockLines_RjmQ"><span class="token-line" style="color:#bfc7d5"><span class="token tag punctuation" style="color:rgb(199, 146, 234)">&lt;</span><span class="token tag" style="color:rgb(255, 85, 114)">script</span><span class="token tag" style="color:rgb(255, 85, 114)"> </span><span class="token tag attr-name" style="color:rgb(255, 203, 107)">type</span><span class="token tag attr-value punctuation attr-equals" style="color:rgb(199, 146, 234)">=</span><span class="token tag attr-value punctuation" style="color:rgb(199, 146, 234)">"</span><span class="token tag attr-value" style="color:rgb(255, 85, 114)">application/ld+json</span><span class="token tag attr-value punctuation" style="color:rgb(199, 146, 234)">"</span><span class="token tag punctuation" style="color:rgb(199, 146, 234)">&gt;</span><span class="token script language-javascript"></span><br></span><span class="token-line" style="color:#bfc7d5"><span class="token script language-javascript">  </span><span class="token script language-javascript punctuation" style="color:rgb(199, 146, 234)">{</span><span class="token script language-javascript"></span><br></span><span class="token-line" style="color:#bfc7d5"><span class="token script language-javascript">    </span><span class="token script language-javascript string-property property">"@context"</span><span class="token script language-javascript operator" style="color:rgb(137, 221, 255)">:</span><span class="token script language-javascript"> </span><span class="token script language-javascript string" style="color:rgb(195, 232, 141)">"https://schema.org"</span><span class="token script language-javascript punctuation" style="color:rgb(199, 146, 234)">,</span><span class="token script language-javascript"></span><br></span><span class="token-line" style="color:#bfc7d5"><span class="token script language-javascript">    </span><span class="token script language-javascript string-property property">"@type"</span><span class="token script language-javascript operator" style="color:rgb(137, 221, 255)">:</span><span class="token script language-javascript"> </span><span class="token script language-javascript string" style="color:rgb(195, 232, 141)">"NewsArticle"</span><span class="token script language-javascript punctuation" style="color:rgb(199, 146, 234)">,</span><span class="token script language-javascript"></span><br></span><span class="token-line" style="color:#bfc7d5"><span class="token script language-javascript">    </span><span class="token script language-javascript string-property property">"headline"</span><span class="token script language-javascript operator" style="color:rgb(137, 221, 255)">:</span><span class="token script language-javascript"> </span><span class="token script language-javascript string" style="color:rgb(195, 232, 141)">"A New Flavour Of Candy Has Been Invented"</span><span class="token script language-javascript punctuation" style="color:rgb(199, 146, 234)">,</span><span class="token script language-javascript"></span><br></span><span class="token-line" style="color:#bfc7d5"><span class="token script language-javascript">    </span><span class="token script language-javascript string-property property">"image"</span><span class="token script language-javascript operator" style="color:rgb(137, 221, 255)">:</span><span class="token script language-javascript"> </span><span class="token script language-javascript punctuation" style="color:rgb(199, 146, 234)">[</span><span class="token script language-javascript"></span><br></span><span class="token-line" style="color:#bfc7d5"><span class="token script language-javascript">      </span><span class="token script language-javascript string" style="color:rgb(195, 232, 141)">"https://example.com/photos/1x1/photo.jpg"</span><span class="token script language-javascript punctuation" style="color:rgb(199, 146, 234)">,</span><span class="token script language-javascript"></span><br></span><span class="token-line" style="color:#bfc7d5"><span class="token script language-javascript">      </span><span class="token script language-javascript string" style="color:rgb(195, 232, 141)">"https://example.com/photos/4x3/photo.jpg"</span><span class="token script language-javascript punctuation" style="color:rgb(199, 146, 234)">,</span><span class="token script language-javascript"></span><br></span><span class="token-line" style="color:#bfc7d5"><span class="token script language-javascript">      </span><span class="token script language-javascript string" style="color:rgb(195, 232, 141)">"https://example.com/photos/16x9/photo.jpg"</span><span class="token script language-javascript"></span><br></span><span class="token-line" style="color:#bfc7d5"><span class="token script language-javascript">    </span><span class="token script language-javascript punctuation" style="color:rgb(199, 146, 234)">]</span><span class="token script language-javascript punctuation" style="color:rgb(199, 146, 234)">,</span><span class="token script language-javascript"></span><br></span><span class="token-line" style="color:#bfc7d5"><span class="token script language-javascript">    </span><span class="token script language-javascript string-property property">"datePublished"</span><span class="token script language-javascript operator" style="color:rgb(137, 221, 255)">:</span><span class="token script language-javascript"> </span><span class="token script language-javascript string" style="color:rgb(195, 232, 141)">"2024-01-05T08:00:00+08:00"</span><span class="token script language-javascript punctuation" style="color:rgb(199, 146, 234)">,</span><span class="token script language-javascript"></span><br></span><span class="token-line" style="color:#bfc7d5"><span class="token script language-javascript">    </span><span class="token script language-javascript string-property property">"dateModified"</span><span class="token script language-javascript operator" style="color:rgb(137, 221, 255)">:</span><span class="token script language-javascript"> </span><span class="token script language-javascript string" style="color:rgb(195, 232, 141)">"2024-02-05T09:20:00+08:00"</span><span class="token script language-javascript punctuation" style="color:rgb(199, 146, 234)">,</span><span class="token script language-javascript"></span><br></span><span class="token-line" style="color:#bfc7d5"><span class="token script language-javascript">    </span><span class="token script language-javascript string-property property">"author"</span><span class="token script language-javascript operator" style="color:rgb(137, 221, 255)">:</span><span class="token script language-javascript"> </span><span class="token script language-javascript punctuation" style="color:rgb(199, 146, 234)">[</span><span class="token script language-javascript"></span><br></span><span class="token-line" style="color:#bfc7d5"><span class="token script language-javascript">      </span><span class="token script language-javascript punctuation" style="color:rgb(199, 146, 234)">{</span><span class="token script language-javascript"></span><br></span><span class="token-line" style="color:#bfc7d5"><span class="token script language-javascript">        </span><span class="token script language-javascript string-property property">"@type"</span><span class="token script language-javascript operator" style="color:rgb(137, 221, 255)">:</span><span class="token script language-javascript"> </span><span class="token script language-javascript string" style="color:rgb(195, 232, 141)">"Person"</span><span class="token script language-javascript punctuation" style="color:rgb(199, 146, 234)">,</span><span class="token script language-javascript"></span><br></span><span class="token-line" style="color:#bfc7d5"><span class="token script language-javascript">        </span><span class="token script language-javascript string-property property">"name"</span><span class="token script language-javascript operator" style="color:rgb(137, 221, 255)">:</span><span class="token script language-javascript"> </span><span class="token script language-javascript string" style="color:rgb(195, 232, 141)">"Jane Doe"</span><span class="token script language-javascript punctuation" style="color:rgb(199, 146, 234)">,</span><span class="token script language-javascript"></span><br></span><span class="token-line" style="color:#bfc7d5"><span class="token script language-javascript">        </span><span class="token script language-javascript string-property property">"url"</span><span class="token script language-javascript operator" style="color:rgb(137, 221, 255)">:</span><span class="token script language-javascript"> </span><span class="token script language-javascript string" style="color:rgb(195, 232, 141)">"https://example.com/profile/janedoe123"</span><span class="token script language-javascript"></span><br></span><span class="token-line" style="color:#bfc7d5"><span class="token script language-javascript">      </span><span class="token script language-javascript punctuation" style="color:rgb(199, 146, 234)">}</span><span class="token script language-javascript"></span><br></span><span class="token-line" style="color:#bfc7d5"><span class="token script language-javascript">    </span><span class="token script language-javascript punctuation" style="color:rgb(199, 146, 234)">]</span><span class="token script language-javascript"></span><br></span><span class="token-line" style="color:#bfc7d5"><span class="token script language-javascript">  </span><span class="token script language-javascript punctuation" style="color:rgb(199, 146, 234)">}</span><span class="token script language-javascript"></span><br></span><span class="token-line" style="color:#bfc7d5"><span class="token script language-javascript"></span><span class="token tag punctuation" style="color:rgb(199, 146, 234)">&lt;/</span><span class="token tag" style="color:rgb(255, 85, 114)">script</span><span class="token tag punctuation" style="color:rgb(199, 146, 234)">&gt;</span><br></span></code></pre><div class="buttonGroup_Sd8_"><button type="button" aria-label="Copy code to clipboard" title="Copy" class="clean-btn"><span class="copyButtonIcons_LnQD" aria-hidden="true"><svg viewBox="0 0 24 24" class="copyButtonIcon_t3l1"><path fill="currentColor" d="M19,21H8V7H19M19,5H8A2,2 0 0,0 6,7V21A2,2 0 0,0 8,23H19A2,2 0 0,0 21,21V7A2,2 0 0,0 19,5M16,1H4A2,2 0 0,0 2,3V17H4V3H16V1Z"></path></svg><svg viewBox="0 0 24 24" class="copyButtonSuccessIcon_IiZV"><path fill="currentColor" d="M21,7L9,19L3.5,13.5L4.91,12.09L9,16.17L19.59,5.59L21,7Z"></path></svg></span></button></div></div></div></code></pre>
<div class="theme-admonition theme-admonition-tip admonition_LMjb alert alert--success"><div class="admonitionHeading_GGQ4"><span class="admonitionIcon_ifdW"><svg viewBox="0 0 12 16"><path fill-rule="evenodd" d="M6.5 0C3.48 0 1 2.19 1 5c0 .92.55 2.25 1 3 1.34 2.25 1.78 2.78 2 4v1h5v-1c.22-1.22.66-1.75 2-4 .45-.75 1-2.08 1-3 0-2.81-2.48-5-5.5-5zm3.64 7.48c-.25.44-.47.8-.67 1.11-.86 1.41-1.25 2.06-1.45 3.23-.02.05-.02.11-.02.17H5c0-.06 0-.13-.02-.17-.2-1.17-.59-1.83-1.45-3.23-.2-.31-.42-.67-.67-1.11C2.44 6.78 2 5.65 2 5c0-2.2 2.02-4 4.5-4 1.22 0 2.36.42 3.22 1.19C10.55 2.94 11 3.94 11 5c0 .66-.44 1.78-.86 2.48zM4 14h5c-.23 1.14-1.3 2-2.5 2s-2.27-.86-2.5-2z"></path></svg></span>tip</div><div class="admonitionContent_pGk6"><p>If you provide a single Open Graph image, go with a size of 1200 x 630 pixels.</p></div></div>
<h3 class="anchor anchorWithStickyNavbar_FNw8" id="8-create-an-image-sitemap">8. Create an image sitemap<a href="https://www.debugbear.com/software/image-optimization-seo#8-create-an-image-sitemap" class="hash-link" aria-label="Direct link to 8. Create an image sitemap" title="Direct link to 8. Create an image sitemap">​</a></h3>
<p>Alongside your existing sitemap, you can also generate an image sitemap that helps Google discover the images on your website.
You can generate these for free using various tools across the web, then upload
the result to <a href="https://www.debugbear.com/software/google-search-console-guide" target="_blank" rel="noopener noreferrer">Google Search
Console</a>.</p>
<h2 class="anchor anchorWithStickyNavbar_FNw8" id="using-images-strategically-to-enhance-seo">Using images strategically to enhance SEO<a href="https://www.debugbear.com/software/image-optimization-seo#using-images-strategically-to-enhance-seo" class="hash-link" aria-label="Direct link to Using images strategically to enhance SEO" title="Direct link to Using images strategically to enhance SEO">​</a></h2>
<p>Truly optimizing your SEO strategy to incorporate images means thinking bigger than simply tweaking the images you
already have. Instead, SEO can inform the images you create, commission and
shoot in the first place. Here are a few search-friendly tactics to consider.</p>
<h2 class="anchor anchorWithStickyNavbar_FNw8" id="conduct-image-related-keyword-research">Conduct image-related keyword research<a href="https://www.debugbear.com/software/image-optimization-seo#conduct-image-related-keyword-research" class="hash-link" aria-label="Direct link to Conduct image-related keyword research" title="Direct link to Conduct image-related keyword research">​</a></h2>
<p>When crafting your SEO content strategy, look for data points that might inform your visual content requirement.
For instance: When considering particular keywords, look for broad matches with
words like <em>picture, diagram, photo, etc</em> – these elements could make excellent
additions to a page or article.</p>
<p><img loading="lazy" src="https://www.debugbear.com/dimg/ede9129b3f3a5d34ab40ba69824710f7.png" alt="Diagram in search
results" style="border-radius:4px" data-abc="true" class="img_CujE"></p>
<p>You can examine your current search traffic using Google Search Console, then
use the filter to reveal any impressions or clicks you're getting from Google
Image Search.</p>
<p><img loading="lazy" src="https://www.debugbear.com/dimg/52771414dd8a1bd00e80547791654075.png" alt="Image searches in Google Search
Console" style="border-radius:4px" data-abc="true" class="img_CujE"></p>
<p>In your SEO tool, filter keywords by results that have image-heavy enrichments like
Knowledge Packs, Image Packs, or AI Overviews.</p>
<p><img loading="lazy" src="https://www.debugbear.com/dimg/ee97d832e27b76cd3f9e0b8398fb46ab.png" alt="SEO research - filter for images" style="border-radius:4px" data-abc="true" class="img_CujE"></p>
<p>Use a similar approach when exploring your competitors' backlinks, keywords and top
pages. You'll also want to manually check your most important keywords in Google
itself, to see if images form part of the search result.</p>
<h2 class="anchor anchorWithStickyNavbar_FNw8" id="create-original-images">Create original images<a href="https://www.debugbear.com/software/image-optimization-seo#create-original-images" class="hash-link" aria-label="Direct link to Create original images" title="Direct link to Create original images">​</a></h2>
<p>Reusing stock photography from elsewhere might make your site look good,
but these images appear on thousands of other websites, so your usage is
unlikely to appear in a prominent position in search.</p>
<p>For key terms, consider designing a graphic, commissioning original photography, or even generating creative imagery using AI.</p>
<p><img loading="lazy" src="https://www.debugbear.com/dimg/1b8e7b635d87dd9f72c99f3ab7131c91.png" alt="Examples of custom-made posters and visualizations" style="border-radius:4px" data-abc="true" class="img_CujE"></p>
<h2 class="anchor anchorWithStickyNavbar_FNw8" id="design-summary-images-and-infographics">Design summary images and infographics<a href="https://www.debugbear.com/software/image-optimization-seo#design-summary-images-and-infographics" class="hash-link" aria-label="Direct link to Design summary images and infographics" title="Direct link to Design summary images and infographics">​</a></h2>
<p>Consider creating custom images that
summarize the key information in your article. For example, perhaps you've
created a list-style article where each item is already illustrated with its own
image. To enhance your SEO, you could create a larger infographic-style image
that brings all these illustrations together into a single visual summary. For
certain searches, these graphics may rank higher. Here's an example where that's
the case:</p>
<p><img loading="lazy" src="https://www.debugbear.com/dimg/69f6901878a252afa2ba677b8f6055b6.png" alt="Summary images of types of pasta - image SEO
tactic" style="border-radius:4px" data-abc="true" class="img_CujE"></p>
<p>Overly 'long' infographics can also perform well on image bookmarking sites like
Pinterest and Tumblr, offering another potential source of backlinks.</p>
<p><img loading="lazy" src="https://www.debugbear.com/dimg/1b8e7b635d87dd9f72c99f3ab7131c91.png" alt="Long
vertical infographics - image SEO
tactic" style="border-radius:4px" data-abc="true" class="img_CujE"></p>
<h2 class="anchor anchorWithStickyNavbar_FNw8" id="reuse-any-overlooked-image-assets-you-own">Reuse any overlooked image assets you own<a href="https://www.debugbear.com/software/image-optimization-seo#reuse-any-overlooked-image-assets-you-own" class="hash-link" aria-label="Direct link to Reuse any overlooked image assets you own" title="Direct link to Reuse any overlooked image assets you own">​</a></h2>
<p>It's also worth taking stock of any images in your archive that might be of interest to the public.</p>
<p>For instance, if you're a wedding photographer, you might have captured a lot of photos of
different wedding venues. You could add these photos to venue reviews on Google
Maps, create a page on your site called 'Wedding venues in Upstate New York -
image gallery', and so on.</p>
<p>There are also free stock photography websites where
you can upload your own images with a suggested credit - your credit could
include a link to your site. (Although currently, Unsplash and Pexels don't
suggest external URLs as a credit.)</p>
<h2 class="anchor anchorWithStickyNavbar_FNw8" id="use-images-as-backlink-generators">Use images as backlink generators<a href="https://www.debugbear.com/software/image-optimization-seo#use-images-as-backlink-generators" class="hash-link" aria-label="Direct link to Use images as backlink generators" title="Direct link to Use images as backlink generators">​</a></h2>
<p>Assuming you own an image (for instance it's a diagram you created yourself) you
might invite website visitors to make their own use of the image, in return for
a backlink to your website. This creates a virtuous circle:</p>
<ol>
<li>Content creators search for a relevant image to include in their content</li>
<li>They discover your image ranking for that keyword</li>
<li>They use your image in their content, including a backlink</li>
<li>This boosts the prominence of your image yet further, making it more likely others will use it too</li>
</ol>
<p>In the example below, you can see a Mighty Networks blog post on self-learning makes use of a Sketchplanations diagram about a related topic:</p>
<p><img loading="lazy" src="https://www.debugbear.com/dimg/6ee94904263ee7905c94b0e1ba88a744.png" alt="Image as backlink generator" style="border-radius:4px" data-abc="true" class="img_CujE"></p>
<p>Just ensure you own the rights to the image, and that credit isn't more
properly due to another creator.</p>
<h2 class="anchor anchorWithStickyNavbar_FNw8" id="check-how-images-impact-your-core-web-vitals">Check how images impact your Core Web Vitals<a href="https://www.debugbear.com/software/image-optimization-seo#check-how-images-impact-your-core-web-vitals" class="hash-link" aria-label="Direct link to Check how images impact your Core Web Vitals" title="Direct link to Check how images impact your Core Web Vitals">​</a></h2>
<p>Images can help you show up more prominently in Google and deliver a great user experience. But they can also slow down your website and drag down the <a href="https://www.debugbear.com/docs/metrics/core-web-vitals">Core Web Vitals</a> scores that <a href="https://www.debugbear.com/docs/core-web-vitals-ranking-factor">impact SEO</a>.</p>
<p><a href="https://www.debugbear.com/">DebugBear</a> can help you identify page speed issues on your website and shows you how to fix them. <a href="https://www.debugbear.com/signup">Sign up for a free trial.</a></p>
<!-- -->
<div class="cta_Vy7l"><div class="ctaContainer_dzq8"><div class="ctaImage_MZ5b"><img src="https://www.debugbear.com/dimg/57001785e35454b95f43aa4f3bf6f857.png" alt="Illustration of website monitoring" class="themedComponent_mlkZ themedComponent--light_NVdE"><img src="https://www.debugbear.com/dimg/b2c0ae7a8dfbc4b18ba827a334c5c1af.png" alt="Illustration of website monitoring" class="themedComponent_mlkZ themedComponent--dark_xIcU"></div><div class="ctaContent_VgWi"><h2>Monitor Page Speed &amp; Core Web Vitals</h2><div class="ctaBenefits_OYw7"><h3>DebugBear monitoring includes:</h3><ul><li>In-depth Page Speed Reports</li><li>Automated Recommendations</li><li>Real User Analytics Data</li></ul></div><div><a href="https://www.debugbear.com/signup" class="ctaButton_Uos9 hidden-when-logged-in"><span>Start Free Trial</span></a><a href="https://www.debugbear.com/app" class="ctaButton_Uos9 visible-when-logged-in"><span>Go To App</span></a></div></div></div></div>]]></content>
        <author>
            <name>Guy Parsons</name>
        </author>
    </entry>
</feed>