

Abstract
Solid state CO2 has been detected throughout the outer solar system, even at temperatures where crystalline CO2 is unstable, requiring that the CO2 be trapped in a separate host material. The Saturnian satellites provide an ideal laboratory for the study of this trapped CO2, allowing us to examine objects with identical insolation, but with a range of environments, ice exposure, organic abundance, and formation locations. Here, we present JWST spectra of eight mid-sized satellites of Saturn, including Mimas, Enceladus, Tethys, Dione, and Rhea interior to Titan, and Hyperion, Iapetus, and Phoebe exterior. The ∼4.26 μm CO2ν3 band is detected on each satellite, and the ∼2.7 μm ν1 + ν3 band is detected on all but Phoebe and the leading hemisphere of Iapetus. Based on the wavelength shifts of these bands, we find four separate types of trapped CO2 on the satellites. On the inner satellites, CO2 appears trapped in amorphous ice sourced from Saturn’s E ring, and a second component of CO2 is associated with the dark material most prominent on the trailing hemispheres of Dione and Rhea. On the outer satellites, CO2 appears to be produced by irradiation of organics on Phoebe, which are then transported to the dark leading hemisphere of Iapetus and onto the dark regions of Hyperion. CO2 is also trapped by water ice on the trailing hemisphere of Iapetus and on Hyperion. These observations point to the continued need for laboratory studies to better understand the sources and trapping mechanisms of CO2 throughout the outer solar system.

Original content from this work may be used under the terms of the Creative Commons Attribution 4.0 licence. Any further distribution of this work must maintain attribution to the author(s) and the title of the work, journal citation and DOI.
1. Introduction
Solid state CO2 is seen throughout the outer solar system, even at temperatures where crystalline CO2 should not be stable over the age of the solar system (C. Ahrens et al. 2022). It is present on at least one Jupiter Trojan asteroid (I. Wong et al. 2024) and on all three icy Galilean satellites (T. B. McCord et al. 1998; S. K. Trumbo & M. E. Brown 2023; G. L. Villanueva et al. 2023; D. Bockelee-Morvan et al. 2024; R. J. Cartwright et al. 2024) and has been detected on most of the larger icy Saturnian satellites (B. J. Buratti et al. 2005; R. N. Clark et al. 2005, 2008; R. H. Brown et al. 2006; D. P. Cruikshank et al. 2010). CO2 is also seen on Centaurs well inside the frost stability line of approximately 15 au (L. A. Lebofsky 1975). The presence of CO2 above its stability temperature implies that CO2 molecules are trapped within some other material. Suggestions have included trapping in crystalline or amorphous water ice (D. P. Cruikshank et al. 2010; D. Bockelee-Morvan et al. 2024; L. Schiltz et al. 2024), in organics (G. L. Villanueva et al. 2023; R. J. Cartwright et al. 2024), in mineral structures (C. A. Hibbitts et al. 2012), and in other materials (C. Ahrens et al. 2022). The source of the CO2 is likewise unclear. Possibilities suggested include that the CO2 is native to the body (C. A. Hibbitts et al. 2003), that it is created from irradiated organics or carbonates (D. Bockelee-Morvan et al. 2024; R. J. Cartwright et al. 2024), or that it might be a product of exogenous infall from comets or chondritic material (R. W. Carlson et al. 2009). Neither the source of the CO2 nor its trapping mechanism has been firmly identified for any of these bodies.
One powerful method for understanding the trapping mechanism (which might be distinct from the source mechanism) of CO2 is the precise position of the ν3 asymmetric stretch band and of the ν1 + ν3 combination band (C–O stretch + asymmetric stretch). In crystalline CO2 at 80 K, these bands appear at 4.268 μm and 2.698 μm, respectively (A. Oancea et al. 2012). When a CO2 molecule is trapped within a foreign material, the molecular shape and bonds are distorted slightly, yielding wavelength shifts of several nanometers or more. Each trapping mechanism yields a characteristic shift, though in some cases different mechanisms can yield similar shifts, rendering identification ambiguous. Shifts in the 4.268 and 2.698 μm bands are independent, and when they are combined, we can better distinguish different trapping mechanisms.
While CO2 was originally detected from the Galileo spacecraft (for the Galilean satellites) and the Cassini spacecraft (for the Saturnian satellites), recent observations of the icy Galilean satellites from JWST have shown that at higher sensitivity and higher spectral resolution, CO2 on the surfaces of these bodies is considerably more complex than previously understood. Europa has CO2 most strongly concentrated in Tara Regio—a region of extensive chaos—with a ν3 doublet at 4.249 and 4.268 μm (S. K. Trumbo & M. E. Brown 2023; G. L. Villanueva et al. 2023). The longer wavelength is consistent with crystalline CO2, which should be extremely unstable at equatorial regions like Tara Regio. Interestingly, a 2.697 μm singlet also appears, again at a similar wavelength to crystalline CO2. G. L. Villanueva et al. (2023) model the CO2 doublet as a combination of trapping in methanol ice and the presence of crystalline CO2, while S. K. Trumbo & M. E. Brown (2023) point to lack of a detection of any organic materials and the instability of crystalline CO2 and suggest trapping of oceanic CO2 gases or the irradiation of carbonates as possible sources and trapping mechanisms.
Ganymede shows a broad, variably asymmetric ν3 band with central wavelengths between 4.257 and 4.260 μm at low latitudes, where the wavelength is correlated with the optical albedo and thus possibly related to the presence of water ice. At high latitudes on the leading hemisphere, the line shifts to 4.2695 μm, close to the expected wavelength of crystalline CO2 (D. Bockelee-Morvan et al. 2024). While the high-latitude CO2 is plausibly trapped in amorphous water ice, the source and trapping mechanism of the low-latitude CO2 remains unknown. Callisto has the strongest CO2 absorption of the Galilean satellites and shows a 4.250 μm band on the trailing hemisphere that shifts as far redward as 4.258 μm in the regions near the Asgard basin (R. J. Cartwright et al. 2024). No satisfactory explanation of the source or trapping of the CO2 has been made.
For the Galilean satellites, precise identification of sources and trapping mechanisms is stymied by the range in temperatures, compositions, irradiation environment, and subsurface structure of each of the satellites. The icy Saturnian satellites, in contrast, present a more uniform case study in trapped CO2. The inner satellites (interior to Titan) have surfaces that are nearly pure water ice, with only trace amounts of localized dark material, while the outer satellites (external to Titan) include more abundant dark material, presumably sourced from Phoebe and its associated ring (A. R. Hendrix et al. 2018). The similarities and differences in CO2 abundances and wavelength shifts on these bodies can allow us to disentangle the effects of ice versus non-ice material, the effects of organics, and the effects of the sources and trapping mechanisms throughout the Saturnian system. While observations from Cassini/VIMS were capable of detecting the CO2 on these objects (D. P. Cruikshank et al. 2010), observations with JWST allow both significantly higher sensitivity and higher spectral resolution. Here, we take advantage of these characteristics to study trapped CO2 across the Saturn system.
2. Observations
We obtained JWST NIRSpec spectra from 1.8 to 5.2 μm of Mimas, Tethys, Dione, and Rhea—mid-sized icy satellites interior to Titan, and of Hyperion, Iapetus, and Phoebe—mid-sized satellites exterior to Titan with at least some dark material. In all cases except Hyperion and Phoebe, which orbit nonsynchronously, we separately obtained spectra of the leading and of the trailing hemispheres. Observational details are given in Table 1. The observations were obtained using the G235H grating at the shortest wavelengths to prevent saturation, and the G395M grism at the longer wavelengths to increase the sensitivity to CO2. In addition, we analyze data from Program 1250 of G235H and G395H spectra of the leading hemisphere (only) of Enceladus. In our observations, all targets were observed with four dithers in the NIRSpec integral field unit (the Enceladus observations obtained only two dithers). The target was visually confirmed in the data, then the data were processed through the empirical point-spread-function-fitting pipeline described in M. E. Brown et al. (2025) using JWST CRDS context file jwst_1252.pmap and pipeline version 1.14.0 (H. Bushouse et al. 2022). Observations of the solar analog P330E (L. Colina & R. Bohlin 1997), from Program 1538, were reduced identically. The stellar spectrum was resampled at the wavelengths corresponding to the combined Doppler shift of the star and the satellite geocentric and heliocentric velocity. The satellite spectrum was then divided by the stellar spectrum to yield a reflectance spectrum with the solar lines removed, as shown in Figure 1. While the JWST pipeline returns uncertainties, we find that empirically derived uncertainties determined by the scatter of the data about a polynomial fit (for regions with no absorption features) provide a more robust result, and such uncertainties are used throughout.
Table 1. JWST Observational Parameters
| Satellite | Date and Time | Exposure | r |

| Δ |

| Longitude |
|---|---|---|---|---|---|---|---|
| (s) | (au) | (km s−1) | (au) | (km s−1) | (deg) | ||
| Mimas (leading) | 2023 Oct 31 05:47 | 291 | 9.75 | −12.3 | 9.32 | 14.4 | 52 |
| Mimas (trailing) | 2024 Jul 24 11:03 | 291 | 9.67 | 13.9 | 8.95 | −6.5 | 262 |
| Tethys (leading) | 2023 Oct 30 18:39 | 116 | 9.75 | −11.2 | 9.31 | 15.7 | 78 |
| Tethys (trailing) | 2024 Jul 20 08:03 | 116 | 9.67 | 10.7 | 9.00 | −11.1 | 271 |
| Dione (leading) | 2023 Nov 9 01:38 | 116 | 9.75 | −10.4 | 9.46 | 18.3 | 98 |
| Dione (trailing) | 2024 Jul 22 01:36 | 116 | 9.67 | 9.37 | 8.98 | −11.9 | 274 |
| Rhea (leading) | 2023 Nov 27 05:27 | 116 | 9.74 | −8.30 | 9.76 | 20.7 | 76 |
| Rhea (trailing) | 2024 Jul 12 13:24 | 116 | 9.68 | 7.88 | 9.10 | −16.3 | 261 |
| Hyperion | 2023 Oct 29 05:57 | 350 | 9.75 | −4.9 | 9.29 | 21.7 | ⋯ |
| Iapetus (leading) | 2023 Oct 16 17:28 | 116 | 9.76 | −3.6 | 9.11 | 19.8 | 80 |
| Iapetus (trailing) | 2024 Jul 25 15:56 | 116 | 9.67 | 2.6 | 8.93 | −17.5 | 267 |
| Phoebe | 2023 Nov 20 22:50 | 1050 | 9.77 | −2.4 | 9.69 | 26.9 | 65 |
Note. Exposure times are identical for the G235H and G395M settings. r and Δ refer to the heliocentric and JWST-centric distances, respectively, with  and
 the heliocentric and JWST-centric velocities. Longitude is the subobserver longitude at the time of observation. Hyperion has no defined longitude system.
Download table as: ASCIITypeset image
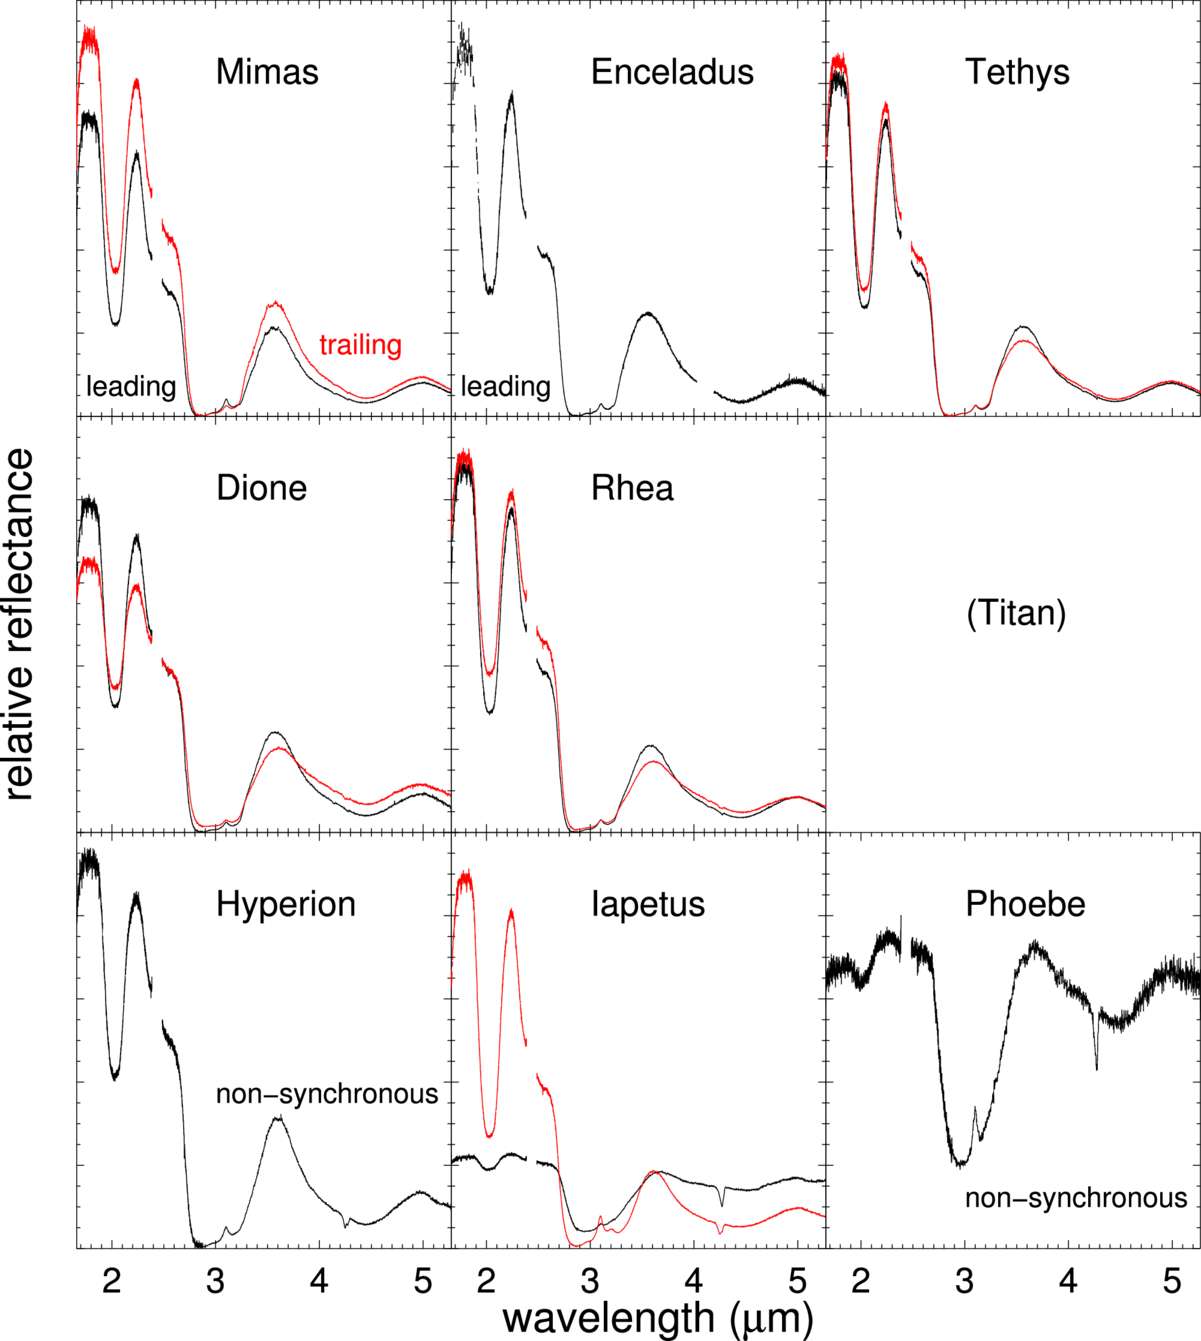
Figure 1. JWST spectra of the satellites of Saturn, in order of distance from Saturn. Titan’s location is marked to distinguish the inner and outer satellite systems. For synchronously rotating satellites, the leading hemisphere is shown in black, while the trailing is in red. For Enceladus, only the leading was observed. For the nonsynchronous Hyperion and Phoebe, only a single observation was made. The leading/trailing hemisphere spectra of individual satellites are scaled correctly relative to each other, but the scaling of the spectra of the different satellites is arbitrary. Uncertainties in the spectra can be estimated from the scatter in the data of these generally smoothly varying spectra.
Download figure:
Standard image High-resolution imageAt the broad scale discernible in Figure 1, the main features visible are the distinct absorptions due to water ice, with bands at 2, 3 and 4.5 μm. For the high-albedo nearly pure water ice surfaces, the 3 μm absorption feature goes to essentially zero reflectivity at 2.87 μm. Phoebe and the leading hemisphere of Iapetus have the least coverage of water ice, as can be seen in their elevated 3 μm reflectivities, and Hyperion and the trailing hemispheres of Dione and Rhea also have slightly nonzero 3 μm reflectivities. Also visible is the 3.1 μm Fresnel reflection peak. The wavelength of this peak shows the presence of ice in crystalline form, though the 3.2 μm secondary peak expected for pure crystalline ice is subdued (except on the trailing hemisphere of Iapetus), allowing the possibility of at least some amorphous ice in the top layers (R. M. Mastrapa et al. 2009). Finally, slight shifts in the ∼3.6 μm peak between the 3 and 4 μm bands show temperature differences, with the trailing hemispheres of Dione and Rhea shifted to slightly longer wavelengths, indicative of higher temperatures, as would be expected for these slightly darker surfaces.
3. Results
An absorption band near the 4.27 μm ν3 CO2 region is detected on every hemisphere of every satellite observed, even where the band was not detectable in Cassini data. To more closely examine this spectral region, we divide each spectrum by an estimated continuum, obtained by performing a second-order polynomial fit to the region between 4.15 and 4.40 μm, excluding the region between 4.20 and 4.30 μm where CO2 absorption might be present. We perform the same fit on data from the leading hemisphere of Enceladus, taken at higher spectral resolution in Program 1250. For the Enceladus spectrum, we rebin by a factor of 3 to approximate the same spectral resolution as the other satellites. The results are shown in Figure 2. All observations show absorptions near 4.25, 4.27 μm, or both. The absorptions on the outer satellites (defined by those beyond the orbit of Titan) are significantly stronger than those on the inner satellites and at slightly different wavelengths. We perform a two-Gaussian fit to each of the continuum-divided spectra in the 4.27 μm region to obtain best-fit models and uncertainties (where, again, the uncertainties in the data are estimated as the scatter in the region outside of the absorption features). The results of the fits are given in Table 2.
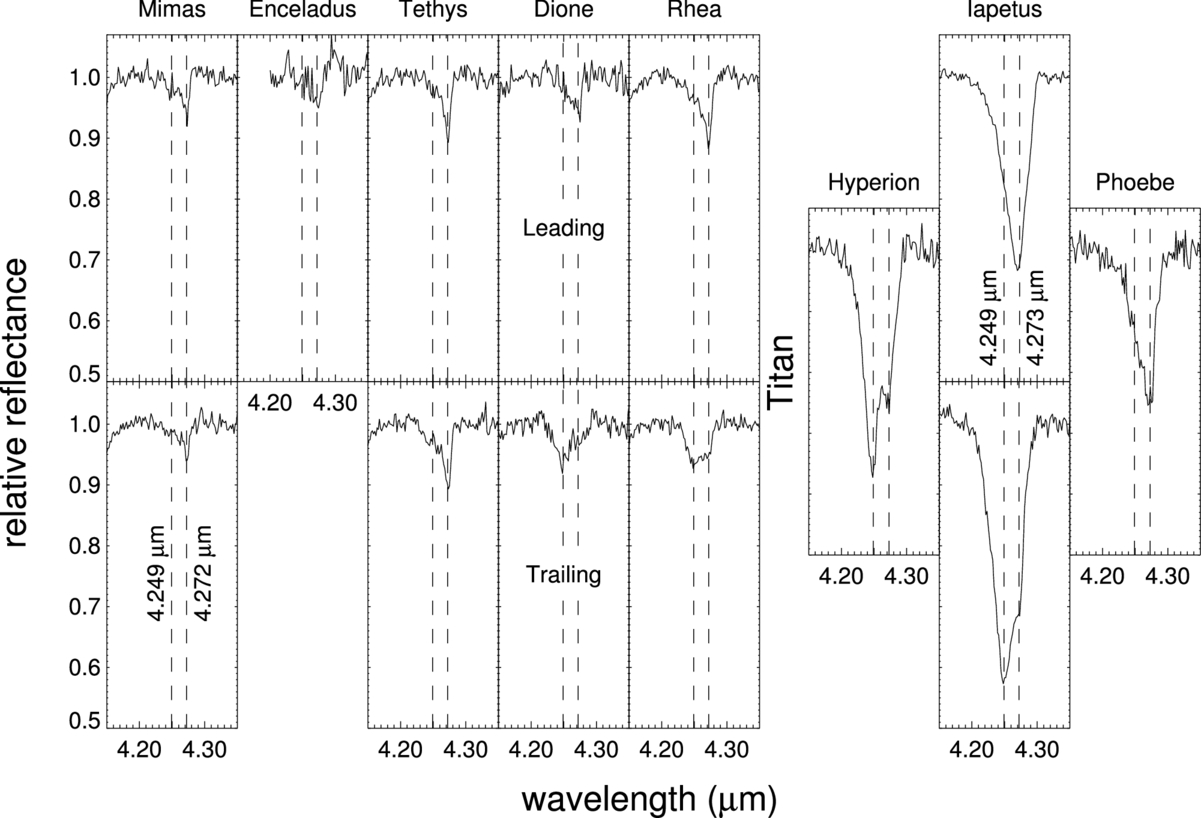
Figure 2. The region near the 4.27 μm ν3 band of CO2 for the Saturnian satellites. The top row shows the leading hemispheres, while the bottom shows the trailing. For nonsynchronous Hyperion and Phoebe, only a single spectrum is shown. Each spectrum was divided by a local continuum to examine relative absorption, and the uncertainties can be estimated by examining the scatter of the data about the continuum. All satellites have absorptions near 4.25 and 4.27 μm or both, though the central wavelengths of the absorption on the outer satellites differ slightly from those of the inner satellites. For the inner satellites, dashed lines are shown at 4.249 and 4.272 μm, while for the outer satellites, dashed lines are shown at 4.249 and 4.273 μm.
Download figure:
Standard image High-resolution imageTable 2. CO2 Band Measurements
| Satellite | Wavelength | Width | Strength | Wavelength | Width | Strength | Wavelength | Width | Strength | |
|---|---|---|---|---|---|---|---|---|---|---|
| (μm) | (μm) | (μm) | (μm) | (μm) | (μm) | |||||
| Mimas | leading | 2.705(1) | 0.010(1) | 0.043(4) | 4.25(2) | 0.017(2) | 0.034(3) | 4.2715(5) | 0.0040(6) | 0.059(7) |
| Mimas | trailing | 2.7082(4) | 0.0062(4) | 0.080(4) | 4.256(5) | 0.017(4) | 0.029(6) | 4.273(7) | 0.003(1) | 0.05(2) |
| Enceladus | ⋯ | 2.7074(3) | 0.0060(3) | 0.063(3) | ⋯ | ⋯ | <0.02 | 4.272(2) | 0.006(2) | 0.06(1) |
| Tethys | leading | 2.7065(4) | 0.0066(4) | 0.069(4) | 4.256(3) | 0.017(2) | 0.037(3) | 4.2720(4) | 0.0041(5) | 0.085(8) |
| Tethys | trailing | 2.7062(6) | 0.0095(6) | 0.0095(6) | 4.255(4) | 0.016(3) | 0.045(6) | 4.2724(6) | 0.0042(8) | 0.09(1) |
| Dione | leading | 2.7081(3) | 0.0056(3) | 0.081(3) | 4.262(2) | 0.011(2) | 0.048(5) | 4.2738(7) | 0.0022(7) | 0.05(1) |
| Dione | trailing | 2.7086(6) | 0.0081(6) | 0.037(2) | 4.248(1) | 0.012(1) | 0.072(5) | 4.277(5) | 0.008(2) | 0.032(6) |
| Rhea | leading | 2.7079(4) | 0.0073(3) | 0.065(3) | 4.252(2) | 0.020(1) | 0.057(3) | 4.2712(4) | 0.0051(5) | 0.085(7) |
| Rhea | trailing | 2.7092(3) | 0.0057(3) | 0.069(3) | 4.252(2) | 0.014(2) | 0.076(4) | 4.272(1) | 0.005(2) | 0.03 (1) |
| Hyperion | ⋯ | 2.6975(1) | 0.0007(1) | 0.16(3) | 4.2473(7) | 0.0147(6) | 0.347(6) | 4.2758(8) | 0.0079(8) | 0.18(1) |
| Iapetus | leading | ⋯ | ⋯ | <0.02 | 4.251(3) | 0.018(1) | 0.13(2) | 4.2724(4) | 0.0124(4) | 0.24(3) |
| Iapetus | trailing | 2.706(1) | 0.015(1) | 0.033(3) | 4.2507(3) | 0.0189(2) | 0.414(4) | 4.2739(3) | 0.0043(4) | 0.113(9) |
| Phoebe | ⋯ | ⋯ | ⋯ | <0.03 | 4.260(1) | 0.0163(7) | 0.16(1) | 4.2735(5) | 0.0060(7) | 0.13(2) |
Note. The wavelength, width, and strength of the absorption are determined by one (for the 2.7 μm region) or two (for the 4.27 μm region) Gaussian fits to the data. The uncertainty in the last significant digit is given in parentheses. The strength is the peak of the Gaussian fit to the continuum-removed data, while the width is the 1σ Gaussian width. For nondetections, a 1σ upper limit to the absorption depth is given.
Download table as: ASCIITypeset image
In addition to the ∼4.27 μm ν3 absorption, Hyperion and the trailing hemisphere of Iapetus have narrow absorptions near the location of the 2.7 μm ν1 + ν3 combination band. Many of the other satellites appear to have a broader feature at slightly longer wavelength. To examine these features more closely, we perform a similar analysis as above to the data, now performing a third-order polynomial fit to the region between 2.660 and 2.760 μm, excluding the regions between 2.690 and 2.703 and between 2.705 and 2.717 μm. Results are shown in Figure 3.
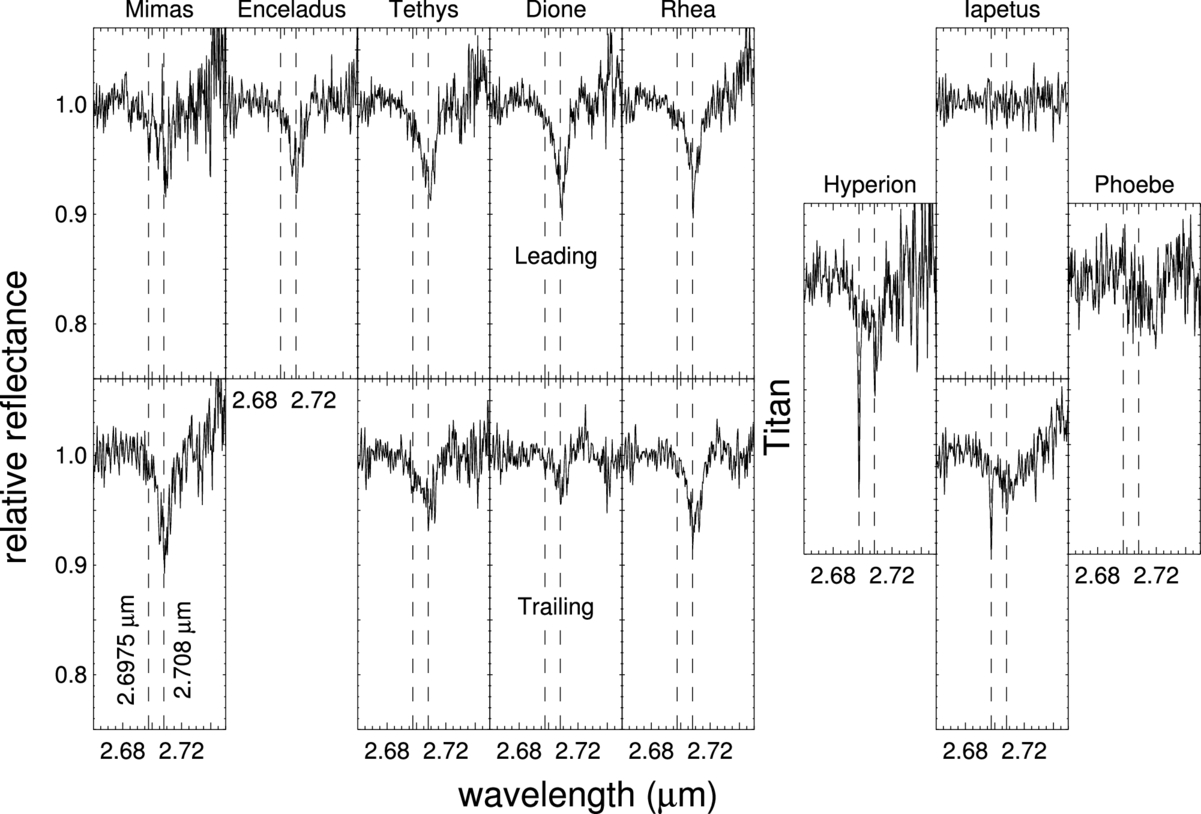
Figure 3. Continuum-divided spectra of the 2.7 μm region near the ν1 + ν3 combination band of CO2. Most satellites have a broad absorption near 2.71 μm, while Hyperion and the bright trailing hemisphere of Iapetus have a narrow absorption near 2.70 μm. Phoebe and the dark leading hemisphere of Iapetus have no discernible absorption. All spectra are shown with dashed lines at 2.6975 and 2.708 μm for clarity.
Download figure:
Standard image High-resolution imageFrom the continuum-divided spectra, narrow absorptions on Hyperion and the trailing hemisphere of Iapetus are evident as well as a broad absorption centered around 2.71 μm on many of the satellites. Uniquely, Phoebe and the dark leading hemisphere of Iapetus show no clear signs of absorption near 2.7 μm, while only Hyperion and the bright trailing hemisphere of Iapetus show the narrow band near 2.70 μm. We determine precise wavelengths, strengths, and widths of these absorption features by fitting the continuum-removed data to a single Gaussian. The results are given in Table 2.
The combination of the spectral characteristics near 4.27 μm and near 2.7 μm makes a crucial distinction clear: while the inner and outer satellites share similar sets of absorptions in the 4.27 μm region, the differences in the 2.7 μm region—including the narrow 2.70 μm absorptions on Hyperion and the trailing hemisphere of Iapetus and the lack of absorption in the 2.7 μm on Iapetus and Phoebe—require that the trapped state of the CO2 on the inner and outer satellites is different, regardless of the similarity of the wavelengths of the 4.27 μm absorptions. We thus consider the inner and outer satellites separately below.
3.1. The Inner Icy Satellites
The CO2 signatures of the mid-sized icy satellites interior to Titan have strong similarities. In all cases, an absorption near 4.272 μm is present, while on the trailing hemispheres of Dione and Rhea, a feature near 4.250 μm also appears, and the feature near 4.272 μm appears diminished. Likewise, a broad feature near 2.708 μm is present on the inner satellites, with the weakest such feature seen on Dione’s trailing hemisphere.
Based on the spectral similarities of the satellites, we assume that they each have the same sets of spectral features. We can thus obtain a higher signal-to-noise spectrum—allowing a more detailed view of the absorptions—by taking spectral averages. We first average both hemispheres of Mimas and Tethys and the leading hemispheres of Dione and Rhea to represent the spectra of surfaces dominated by the feature near 4.272 μm. Second, we average the trailing hemispheres of Dione and Rhea to represent the surfaces more dominated by the feature near 4.250 μm. These average spectra are shown in Figure 4. Performing Gaussian fits identical to those done for the individual spectra, we find that in both averaged spectra, the short wavelength bands are centered at 2.708 ± 0.002 μm, while the strongest longer-wavelength band is found at 4.2724 ± 0.0002 μm for the first average and 4.249 ± 0.001 μm for the second set of averaged spectra.
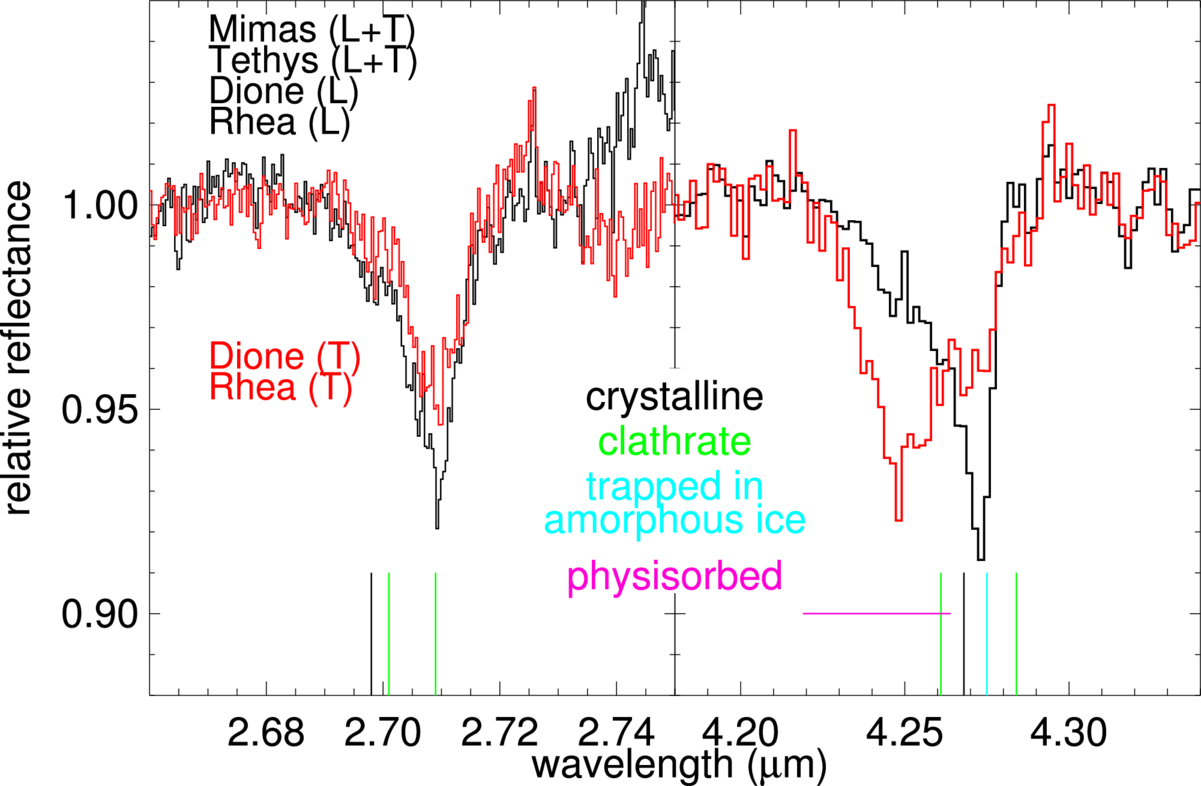
Figure 4. An average of the continuum-removed spectra of the leading and trailing hemispheres of Mimas and Tethys and the leading hemispheres of Dione and Rhea, in black, and of the trailing hemispheres of Dione and Rhea, in red. The lines at the bottom show measured wavelengths of CO2 in different states, including in pure crystalline form and trapped as clathrate in crystalline water ice (A. Oancea et al. 2012), trapped in amorphous ice (S. A. Sandford & L. J. Allamandola 1990; Ó. Gálvez et al. 2008), and physisorbed onto minerals (C. Hibbitts & J. Szanyi 2007), which can lead to a wide range of wavelengths. The shorter-wavelength 4.2487 μm line associated with the darker hemispheres of Dione and Rhea appears to have no corresponding absorption in the 2.7 μm region.
Download figure:
Standard image High-resolution imageBased both on optical imaging (P. Schenk et al. 2011) and the depth of the 3 μm absorption, the trailing hemispheres of Dione and Rhea have the strongest concentrations of dark nonwater ice material. The presence of the shorter-wavelength 4.249 μm absorption on the trailing sides of these two satellites leads to the hypothesis that this absorption is associated with the trapping of CO2 in this dark material and that the weakness of the 4.272 μm absorption on these trailing hemispheres is due to this extra covering of dark material. While this shorter-wavelength feature is strongest on these two satellites, it appears to be present on all of the inner satellite spectra, where the asymmetric nature of the 4.273 μm band, with a broad wing to shorter wavelengths, is plausibly caused by the blending of a small amount of the shorter-wavelength absorption. Indeed, optical imaging shows that the dark material is seen throughout the inner satellites, even if dominant on the trailing hemispheres of Dione and Rhea (P. Schenk et al. 2011).
The composition of the dark material on the inner satellites remains unidentified, but the shift of the ν3 line to shorter wavelength can be caused by the trapping of the CO2 molecule into a tightly confined space (S. A. Sandford & L. J. Allamandola 1990). For example, cryogenic experiments with trapping in zeolites and clays showed absorption features ranging from 4.219 to 4.264 μm (C. Hibbitts & J. Szanyi 2007). R. N. Clark et al. (2005, 2008) have argued that the dark material throughout the Saturnian system is a fine-grained material, possibly a nanophase hematite or iron. While no relevant spectroscopic studies of CO2 trapped by these types of materials or studies at these temperatures have been performed, such small iron oxides could be efficient at CO2 capture (J. Baltrusaitis et al. 2011; A. Hakim et al. 2016).
The association of the shorter-wavelength 4.249 μm absorption with the dark material suggests that the longer-wavelength feature and the 2.708 μm absorption could be due to CO2 trapped in the water ice, which dominates the remainder of these surfaces. Indeed, the measured wavelength for both spectral lines (2.708 ± 0.002 and 4.2724 ± 0.0002 μm) is nearly coincident with the values measured (2.705 and 4.2737 μm) for CO2 absorption in a 100 K codeposited 50:1 mixture of amorphous water ice and CO2 (S. A. Sandford & L. J. Allamandola 1990).
The inner satellites are all embedded within Saturn’s E ring, which is sourced from the geysers on the south pole of Enceladus (F. Spahn et al. 2006). These particles themselves are composed of water ice with possible inclusions of silicates, organics, and CO2 (J. K. Hillier et al. 2007; F. Postberg et al. 2008). While observations of satellite albedo, color, infrared spectra, and particulate grain sizes have led to varying conclusions about the interaction between the surfaces of the satellites and the E-ring particles (i.e., C. J. A. Howett et al. 2018), Cassini radar observations suggest that these inner satellites are coated with decimeters of fresh clean water ice from the E ring (A. Le Gall et al. 2019). If correct, it is likely that the observed CO2 is trapped in amorphous water carried in from the E-ring particles. The actual source of the CO2 is less certain. While it could plausibly be carried in with the E-ring particles or formed from radiolysis of embedded organic materials, it is also possible that the CO2 is native to each individual satellite and is released from the surface or subsurface only to be trapped by the ice.
3.2. The Outer Satellites
The three observed satellites that are exterior to Titan have stronger CO2 absorptions and appear to have different forms of CO2 than those interior to Titan. Figure 5 shows the continuum-removed spectra from the 2.7 μm ν1 + ν3 CO2 absorption region and the 4.27 μm ν3 absorption region for these satellites. As with the inner satellites, there appear to be two separate trapped states of CO2, reflected in a shorter- and longer-wavelength component of the ν3 absorption. The two lines both contribute strongly and overlap across the band, so precise estimation of band centers is less certain, but the shorter-wavelength feature averages 4.2487 ± 0.0004 μm on the two spectra where the lines are strongest. Likewise, the longer-wavelength feature averages 4.2730 ± 0.0003 μm on the two spectra where this component is strongest.
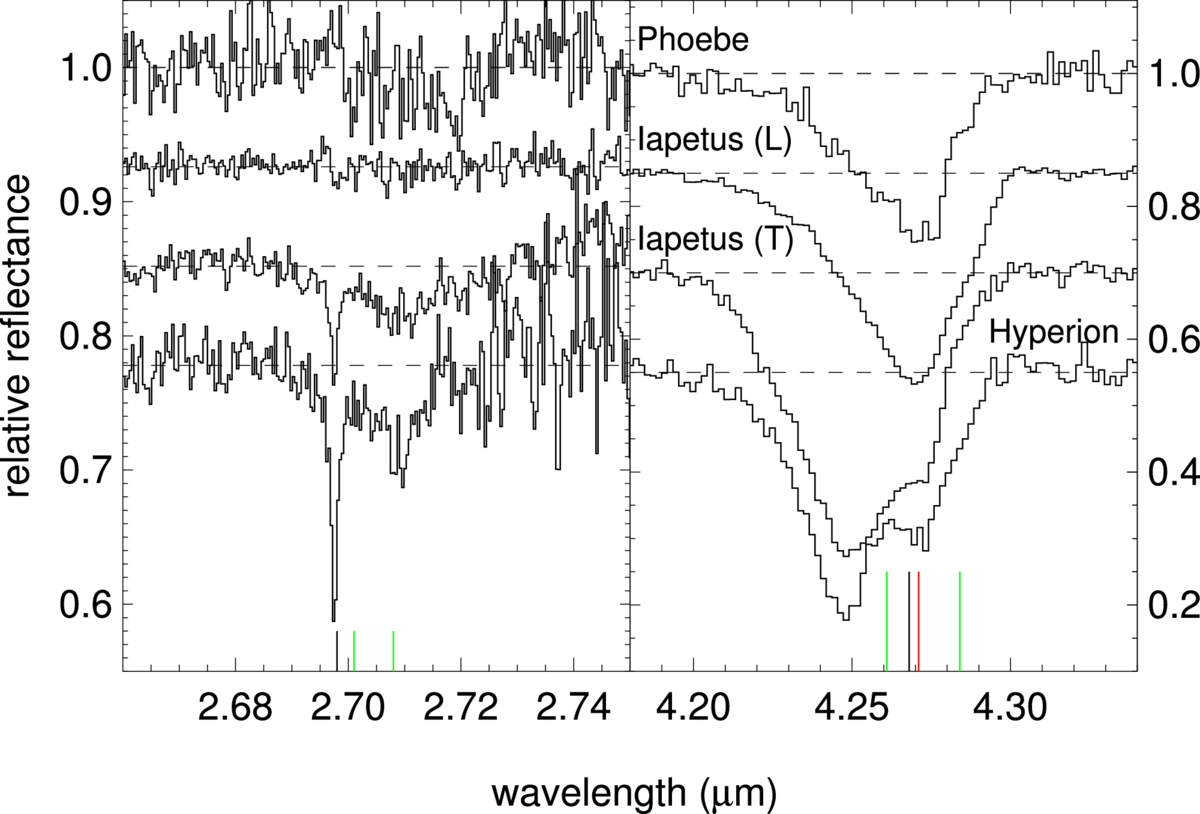
Figure 5. Continuum-removed views of the 2.7 and 4.27 μm regions of the spectra of the outer satellites. The colored lines show the wavelengths of various forms of CO2, as in Figure 4. The black line again shows the wavelength of crystalline CO2, and the green lines show those of CO2 clathrates. The red line (not shown in Figure 4), which is consistent with the wavelength seen in the high signal-to-noise Iapetus data, is the wavelength of CO2 formed in irradiated organic material.
Download figure:
Standard image High-resolution imageOn Phoebe, spatially resolved observations from Cassini found that the CO2 absorption is most strongly associated with the dark material (R. N. Clark et al. 2005). The leading hemisphere of Iapetus is known to be coated with this dark material, which spirals inward through the large Phoebe ring (A. J. Verbiscer et al. 2009). The location of the dominant CO2 absorption on the leading hemisphere of Iapetus matches that of Phoebe to the 2σ level. The 4.2730 ± 0.0003 average position of this line is close to, but not coincident with, the 4.2724 ± 0.0002 line of the inner satellites, though the strong blending of the lines for the outer satellites makes the reliability of the differences between these values less certain.
We thus associate this 4.2730 μm absorption with the dark material on Phoebe and Iapetus. The brighter trailing hemisphere of Iapetus and the interiors of the craters on Hyperion contain minor amounts of the dark material, and indeed, a long-wavelength absorption appears weakly in the spectra of both the leading hemisphere of Iapetus and of Hyperion, where they are blended with the stronger, shorter-wavelength absorption at 4.2487 μm. While the lower signal-to-noise Phoebe data show some variability around 2.7 μm, the higher signal-to-noise data on the dark hemisphere of Iapetus make it clear that this dark material shows no clear indications of any absorption due to the 2.7 μm ν1 + ν3 band.
A plausible source for CO2 in the dark material of Phoebe is the irradiation of organic material in close proximity to water ice. Laboratory experiments have found that irradiation of ice-covered organics at temperatures similar to that in the Saturnian system produce a ν3 CO2 band at 4.271 ± 0.002 μm, consistent with the wavelength measured here (O. Gomis & G. Strazzulla 2005). Unfortunately, these experiments do not examine the 2.7 μm region, so it is unclear if the lack of ν1 + ν3 absorption seen on Phoebe and the dark hemisphere of Iapetus is also reproduced. Interestingly, the C–H stretch absorption features in the 3.4 μm region suggested to be present by D. P. Cruikshank et al. (2014) do not appear in these JWST data, though smaller irregular satellites do appear to have features in this region (M. Belyakov & M. E. Brown 2025). More analysis is required to understand the presence and state of organic material on these satellites, but the existence of at least some organic materials on a dark outer solar system body such as Phoebe seems likely.
The association of the longer-wavelength 4.2730 μm absorption with the dark material on the outer satellites suggests that either the Phoebe-sourced dark material and its associated CO2 are transported to these other satellites or that the dark material is transported without the CO2 (or loses its CO2 upon impact) and the CO2 is then regenerated on the satellites themselves through subsequent irradiation. Some evidence for the latter hypothesis is that spatially resolved Cassini spectra of these satellites suggest that the CO2 absorption is strongest in the transition regions between the bright and dark materials, where the dark material would have the highest access to water that can aid the radiolytic production of CO2 (E. E. Palmer & R. H. Brown 2011).
If CO2 is being continuously created on these satellites from the irradiation of freshly delivered organic material, the strong CO2 signature on the icy parts of these bodies are then plausibly produced from the same mechanism but then separately trapped in that icy material. It is surprising that CO2 trapped in ice has a different wavelength in the outer satellite system than in the inner, but the presence of the 2.6975 μm absorption exclusively on the brighter, icier trailing hemisphere of Iapetus and on water-ice-rich Hyperion suggests that the CO2 is associated with ice on these satellites but in a physically different way than on the inner satellites.
While some experiments on trapping of CO2 in water ice have shown small secondary absorption features near the 4.248 μm feature seen here (M. S. Gudipati et al. 2023; L. Schiltz et al. 2024), no trapping mechanism in either crystalline or amorphous water ice has been measured to have a prominent peak at this position. Additionally, no trapping mechanism has ever been found to make a narrow 2.6975 μm feature like those seen here (though this weaker combination band is often not studied in laboratory experiments). These observations point to the need for substantially more laboratory work on the trapping of CO2 and point to plausible materials on which to focus future work.
3.3. 13CO2
With the detections of the strong CO2 bands on the outer satellites, we consider the possibility of the detection of the 4.384 μm absorption due to the isotopologue 13CO2. Figure 6 shows the continuum-divided region near the predicted 13CO2 line and Gaussian fits to the Hyperion, Iapetus (leading and trailing), and Phoebe spectra. No absorptions are seen in most of the spectra, but the trailing hemisphere of Iapetus shows a 4.3% ± 0.5% absorption centered at 4.383 ± 0.001 μm, consistent with the expected 13CO/12CO2 band. While ratios of band strengths between the 13CO2 and 12CO2 bands cannot be used to directly infer the 13C/12C ratio, as the trapping mechanisms can affect these molecules differently, the values are informative for comparison between the bodies. We find 1σ upper limits of 0.020, 0.008, and 0.012 for Hyperion, the leading hemisphere of Iapetus, and Phoebe, respectively, and we measure a ratio of 0.019 ± 0.02 for the trailing hemisphere of Iapetus. R. N. Clark et al. (2019) report values measured from VIMS data on Iapetus (dark material) and Phoebe (full disk) of 0.012 ± 0.001 and 0.053 ± 0.006, respectively. While the VIMS Iapetus value is a plausible combination of some fraction of the leading and trailing hemisphere values measured here, the high abundance of 13CO2 reported for Phoebe would require a 4.9% absorption feature, which can be ruled out here at the 5σ level.
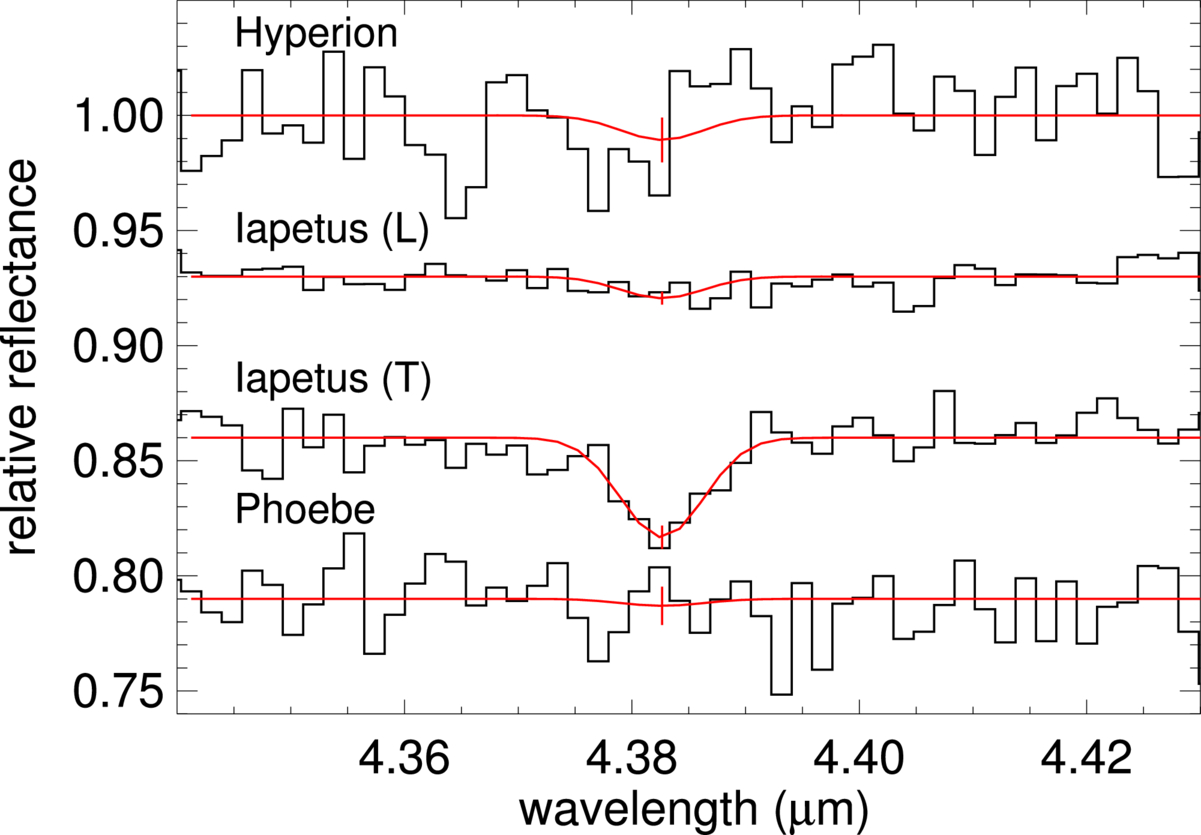
Figure 6. Continuum-divided region of the spectra containing the expected 13CO2 absorption feature. Each spectrum is offset by 0.07 units for clarity. A single Gaussian fit to the data is used to determine detection limits or the strength of the absorption. The vertical red bar shows the 1σ uncertainty on the line strength.
Download figure:
Standard image High-resolution imageThe 13CO2/12CO2 ratio measured for the trailing hemisphere of Iapetus is higher than the upper limits measured for both Phoebe and for the leading hemisphere of Iapetus, reinforcing the conclusion above that the Iapetus leading hemisphere CO2 differs in source, trapping mechanism, or both from that of the trailing hemisphere and of Phoebe. The less stringent Hyperion upper limit remains consistent with the measured value for the leading hemisphere of Iapetus, in agreement with our suggestion that the CO2 at these locations are related. While we cannot directly infer the 13C/12C ratio from these results, we note that the ratios are broadly consistent with the measured interstellar isotopic ratio of 0.014 ± 0.003 (A. C. A. Boogert et al. 2000) and with the terrestrial value of 0.011.
4. Discussion
The satellites of Saturn have at least two separate sources of CO2 and at least four separate trapping mechanisms. The inner satellites have a CO2 component with a ν3 absorption at 4.2724 ± 0.0002 μm and a broad ν1 + ν3 combination band at 2.708 ± 0.002 μm. This CO2 appears to be associated with the ice component of these satellites, with the likely source either the E-ring particles or CO2 native to each satellite. A second component on the inner satellites has a ν3 absorption at 4.249 ± 0.001 μm and no corresponding ν1 + ν3 absorption. This CO2 appears to be trapped in the dark materials most strongly seen on the trailing hemispheres of Dione and Rhea. The source could again be native or could be the dark material itself. The outer satellites have a CO2 component with a ν3 absorption at 4.2730 ± 0.0003 μm that has no measurable ν1 + ν3 component. This CO2 appears to be associated with the abundant dark material present on Phoebe, the leading hemisphere of Iapetus, and parts of Hyperion. The CO2 is plausibly created from irradiation of organics associated with this dark material. A second CO2 component on the outer satellites has a ν3 absorption at 4.2487 ± 0.0004 μm and a narrow ν1 + ν3 band at 2.6975 ± 0.0001 μm as well as the same broad 2.708 ± 0.002 μm band seen in the inner satellites. This component appears associated with the icy regions of the outer satellites, and the source could either be native or CO2 released from the darker regions.
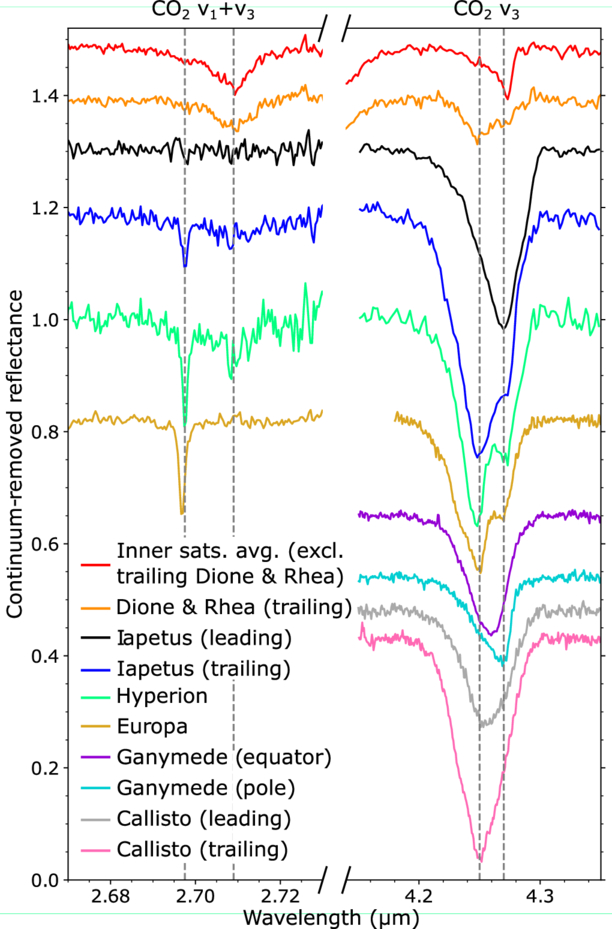


Figure 7. A comparison of CO2 detected on the Saturnian satellites with the icy Galilean satellites. Dashed lines are shown at 2.6975 and 2.708 μm and at 4.25 and 4.27 μm for reference. Ganymede and Callisto have no JWST observations at 2.7 μm with which to compare.
Download figure:
Standard image High-resolution image

These observations have interesting implications for the icy Galilean satellites and the state of their CO2 as well (Figure 7). Interpretations for the CO2 detected on the Galilean satellites are sometimes similar to the interpretations we have made here for the Saturnian satellites, though in some cases the similarity of the interpretation is in spite of large spectral differences. The CO2 signature on Europa appears intriguingly similar to that on Hyperion and on the trailing hemisphere of Iapetus. All three bodies exhibit the ν3 band as a doublet, with wavelengths of approximately 4.25 and 4.27 μm, and a narrow ν1 + ν3 feature near 2.7 μm. On the Saturnian satellites, the differences between Phoebe, Iapetus, and Hyperion demonstrate that the longer-wavelength ν3 feature is associated with the dark, plausibly organic material, while the shorter ν3 peak and the narrow ν1 + ν3 band are associated with the water ice (or at least the icy regions). On Europa, however, the 2.7 μm combination band appears more spatially correlated with the longer-wavelength ν3 peak (G. L. Villanueva et al. 2023), suggesting that a different interpretation is necessary for these very similar signatures. Indeed, Europa shows no spectral signatures of organic material or evidence of Phoebe-like dark material (S. K. Trumbo & M. E. Brown 2023). No satisfactory explanation for the spectral signatures of CO2 on Europa has yet to be presented, and the resemblance to Iapetus and Hyperion remains a mystery, though upcoming additional spatial coverage of Europa by JWST may help to resolve some of these ambiguities. On Ganymede, the CO2 at the poles has been interpreted to be trapped in amorphous water ice, and the 4.27 μm band appears similar to that of the inner Saturnian satellites (D. Bockelee-Morvan et al. 2024). Unfortunately, no shorter-wavelength (G235H) JWST NIRSpec data of Ganymede exist, so no comparison to the 2.7 μm region can be made. The equatorial CO2 on Ganymede resembles none of the features on Saturn nor on the other Galilean satellites and remains a mystery. On Callisto, the ν3 CO2 band is similar both to that associated with the dark material on the trailing hemispheres of Dione and Rhea (which has no associated 2.7 μm absorption) and to that associated with the water ice on the outer Saturnian satellites (which has a narrow 2.7 μm absorption). R. J. Cartwright et al. (2024) suggest that, at least on the trailing hemisphere, the CO2 forms radiolytically in and is trapped by carbonaceous material, though laboratory studies of the irradiation of organic materials show longer-wavelength ν3 bands (i.e., O. Gomis & G. Strazzulla 2005). The similarity of the ν3 absorptions on the dark terrains of Callisto to that of the CO2 associated with the dark contaminants of the inner Saturnian satellites is intriguing, and, again, a comparison of the 2.7 μm regions would be instructive, though, again, no 2.7 μm data for Callisto have yet been obtained. On the leading hemisphere of Callisto, the ν3 band center shifts in a way consistent with the inclusion of a CO2 component mixed in water ice, reminiscent of the longer-wavelength ν3 on the inner satellites of Saturn where a broad 2.71 μm absorption is also present.
Observations of the Saturnian system, and a comparison across satellites and across wavelengths, have finally allowed a consistent picture of the sources of CO2 and the mechanisms of its trapping to begin to be assembled. Significant work remains, however, to fully understand CO2 here and elsewhere in the solar system, including additional laboratory work exploring trapping materials and mechanisms proposed here, a more complete set of observations of the Galilean satellites, and a more in-depth examination of the dark material on the outer satellites of the Saturnian system.
Acknowledgments
We thank two anonymous referees for helping us to strengthen the arguments put in this paper. This work is based on observations made with the NASA/ESA/CSA James Webb Space Telescope. The data were obtained from the Mikulski Archive for Space Telescopes (MAST) at the Space Telescope Science Institute, which is operated by the Association of Universities for Research in Astronomy, Inc., under NASA contract NAS 5-03127 for JWST. These observations are associated with program #3716. Support for program #3716 was provided by NASA through a grant from the Space Telescope Science Institute, which is operated by the Association of Universities for Research in Astronomy, Inc., under NASA contract NAS 5-03127. The specific observations analyzed can be accessed via doi:10.17909/30px-vq56.
Facility: JWST (NIRSpec) - .