
In favour! FIIs buy 7 multibaggers that soared up to 730% after 2 quarters of selling
NewsAug 24, 2026
 US Stocks
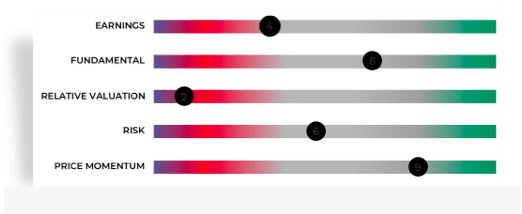
What's Stock Score?
Stock Score is the Average Score from Stock Reports Plus by Refinitiv which combines quantitative analysis of widely used investment decision making tools. This score is on a 10 point scale (1 is lowest and 10 being the highest, NR indicates No-rating is available)
You can access 4000+ Stock Reports with ET Prime. Know More
PE RatioThis is a ratio arrived at by dividing the current market price of a stock by its latest (annual or annualized) earnings per share. Here we have taken the TTM (trailing twelve months) adjusted earnings per share. | 49.02 | ||||||||||
EPS - TTMEarnings per share (TTM) tells the profit after tax earned on a per share basis by a stock over the last twelve months or four quarters. | 18.42 | ||||||||||
MCapMCap or Market capitalization of a stock is calculated by multiplying the total number of shares outstanding of that particular stock with its current market price. | 5,200.51 | ||||||||||
Sectoral MCap RankThis is the ranking of a company within its sector based on MCap or Market capitalization. Higher the market capitalization of a company, higher the rank it is assigned. | 31 | ||||||||||
PB RatioPrice to Book represents the ratio of current market price of a stock to its book value per share. The book value itself is arrived at by dividing the net worth of a company by the total number of shares outstanding of the company at that time. | 11.17 | ||||||||||
Dividend YieldDividend Yield calculates the amount of full year dividend declared by a company as a percentage of the current market price of a stock. All other things being equal, higher the dividend yield of the stock, the better it is for investors. | 0.30 | ||||||||||
Face ValueFace value of a stock is the value ascribed to the stock as per the balance sheet of the company. The dividend declared by a company is usually declared as a percentage of face value. | 2.00 | ||||||||||
Beta
| - | ||||||||||
VWAPVolume Weighted Average Price represents the average price of a security over a particular time period (example one trading day) weighted by the volume traded at each price point. | 903.90 | ||||||||||
52W H/LThis represents the 52 week high and low price of the security. It is also the 1 year high and low of the security. This represents the highest and lowest price touched by the security during the past 52 weeks or 1 year including today. | 1,215.70 / 368.60 |
Shivalik Bimetal Controls Ltd. share price moved down by -3.31% from its previous close of Rs 933.70. Shivalik Bimetal Controls Ltd. stock last traded price is 902.80
| Share Price | Value |
|---|---|
| Today/Current/Last | 902.80 |
| Previous Day | 933.70 |
| 1 Day | -3.31% |
| 1 Week | -11.83% |
| 1 Month | -21.9% |
| 3 Months | 19.87% |
| 1 Year | 90% |
| 3 Years | 74.49% |
| 5 Years | 395.32% |
Check whether Shivalik Bimetal belongs to analysts' top-rated companies list?
View Stock Screeners


Current
Mean Recos by 1 Analysts
| Ratings | Current | 1 Week Ago | 1 Month Ago | 3 Months Ago |
|---|---|---|---|---|
| Strong Buy | - | - | - | - |
| Buy | 1 | 1 | 1 | 1 |
| Hold | - | - | - | - |
| Sell | - | - | - | - |
| Strong Sell | - | - | - | - |
| # Analysts | 1 | 1 | 1 | 1 |
| | JUN 2026 | MAR 2026 | DEC 2025 | SEPT 2025 | JUN 2025 |
|---|---|---|---|---|---|
| Total Income | 185.54 | 166.04 | 137.33 | 141.00 | 138.76 |
| Total Income Growth (%) | 11.75 | 20.90 | -2.60 | 1.61 | 2.16 |
| Total Expenses | 142.68 | 130.81 | 106.45 | 109.69 | 107.92 |
| Total Expenses Growth (%) | 9.07 | 22.88 | -2.95 | 1.64 | 0.85 |
| EBIT | 42.86 | 35.22 | 30.88 | 31.31 | 30.84 |
| EBIT Growth (%) | 21.67 | 14.06 | -1.36 | 1.51 | 7.04 |
| Profit after Tax (PAT) | 33.01 | 26.05 | 22.18 | 24.85 | 22.78 |
| PAT Growth (%) | 26.72 | 17.45 | -10.77 | 9.10 | 8.21 |
| EBIT Margin (%) | 23.10 | 21.21 | 22.49 | 22.20 | 22.23 |
| Net Profit Margin (%) | 17.79 | 15.69 | 16.15 | 17.63 | 16.42 |
| Basic EPS () | 5.73 | 4.54 | 3.38 | 4.27 | 3.96 |
All figures in Rs Cr, unless mentioned otherwise
View Details
111.70
Amount Invested (in Cr.)
1.82531696%
% of AUM
0.00
% Change (MoM basis)
61.43
Amount Invested (in Cr.)
1.09%
% of AUM
0.00
% Change (MoM basis)
50.46
Amount Invested (in Cr.)
2.92489114%
% of AUM
0.00
% Change (MoM basis)
| Meeting Date | Announced on | Purpose | Details |
|---|---|---|---|
| Sep 2, 2026 | Aug 11, 2026 | AGM | General Meeting |
| Aug 6, 2026 | Jul 30, 2026 | Board Meeting | Quarterly Results & A.G.M. |
| May 18, 2026 | May 11, 2026 | Board Meeting | Audited Results & Final Dividend |
| Feb 5, 2026 | Jan 29, 2026 | Board Meeting | Quarterly Results & Interim Dividend |
| Nov 18, 2025 | Oct 15, 2025 | EGM | General Meeting |
| Nov 12, 2025 | Nov 6, 2025 | Board Meeting | Quarterly Results |
| Aug 13, 2025 | Aug 6, 2025 | Board Meeting | Quarterly Results |
| Sep 16, 2025 | Aug 22, 2025 | AGM | General Meeting |
| Jan 31, 2025 | Jan 7, 2025 | EGM | General Meeting |
| Sep 26, 2024 | Aug 30, 2024 | AGM | Rs.1.0000 per share(50%)Final Dividend & A.G.M. |
Shivalik Bimetal Controls Ltd., incorporated in the year 1984, is a Small Cap company (having a market cap of Rs 5,200.51 Crore) operating in Metals - Ferrous sector.
Shivalik Bimetal Controls Ltd. key Products/Revenue Segments include Sale of Services for the year ending 31-Mar-2026.
N S Ghumman
Chairman & Wholetime DirectorKabir Ghumman
Managing DirectorSumer Ghumman
Whole Time DirectorG S Gill
Non Executive DirectorIndustry
Key Indices Listed On
BSE SmallCap, BSE Industrials, BSE AllCap, + 4 more
Address
16-18, New Electronics Complex,, Chambaghat,, Solan District, Himachal Pradesh, 173213
DATA SOURCES: TickerPlant (for live BSE/NSE quotes service) and Dion Global Solutions Ltd. (for corporate data, historical price & volume, F&O data). Sensex & BSE Quotes and Nifty & NSE Quotes are real-time and licensed from BSE and NSE respectively. All timestamps are reflected in IST (Indian Standard Time).
DISCLAIMER: Any and all content on this website including tools/analysis is provided to you only for convenience and on an “as-is, as- available” basis without representation and warranties of any kind. The content and any output of such tools/analysis is for informational purposes only and should not be relied upon or construed as an investment advice or guarantee for any specific performance/returns advice or considered as recommendation for the purchase or sale of any security or investment. You are advised to exercise caution, discretion and independent judgment with regards to the same and seek advice from professionals and certified experts before taking any decisions.
By using this site, you agree to the Terms of Service and Privacy Policy.
